Single source supplier risk is what a plant is exposed to when a part comes from only one approved supplier or site. If that source goes down, so does the line. Managing it takes five steps: flag single-source parts on the bill of materials, compare time-to-survive with time-to-recover, cost a stop in contribution margin, choose a mitigation, and plan how to qualify a second source.
-
Flag every BOM line, sub-tier inputs included, that has one approved manufacturing site.
-
Rank those parts by comparing time-to-survive (TTS) with time-to-recover (TTR).
-
Cost a stop in lost contribution plus incremental recovery spend.
-
For each part, pick buffer stock, a second source, a second site, or accepted risk.
-
Plan PPAP qualification for any new source.
What happened at Dearborn and Kansas City
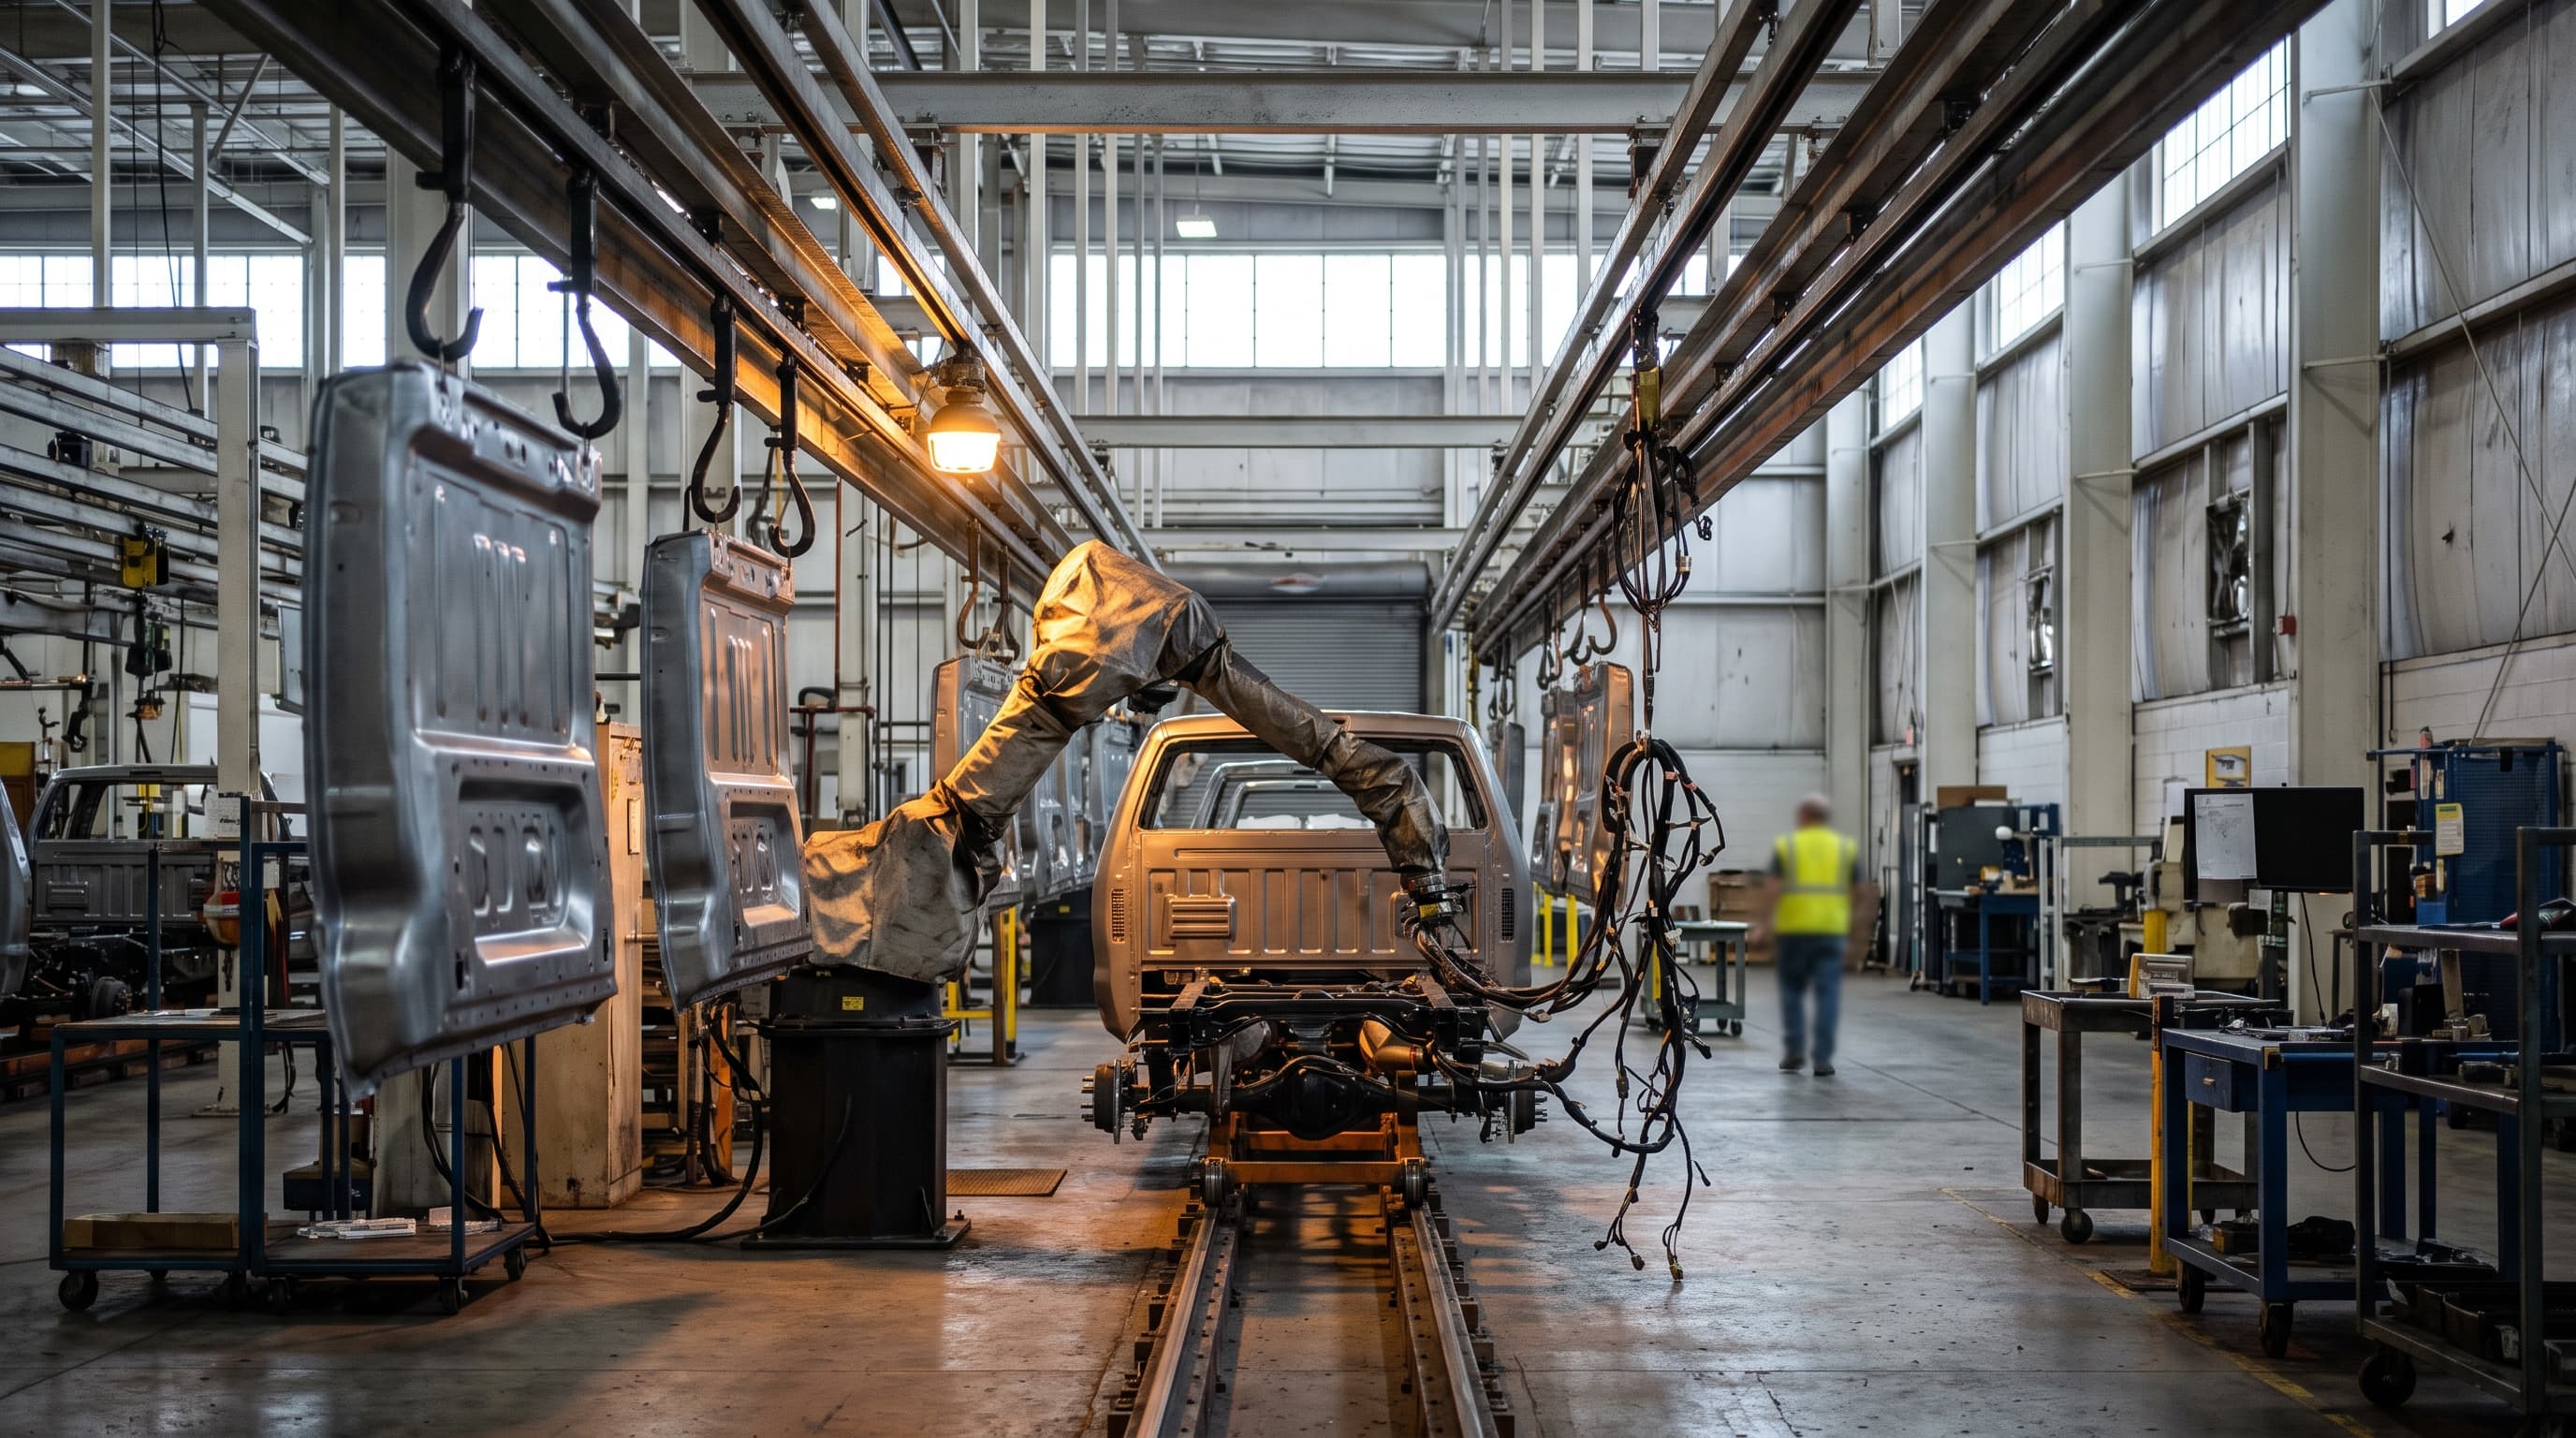
Ford stopped F-150 production at Dearborn Truck Plant in Michigan starting Thursday, Sept. 24, 2026, because of a supplier problem. Production was set to restart on Tuesday, Sept. 29, according to CBT News and The Deep Dive. Mark DePaoli, director of UAW Region 1A, said Ford told 3,500 to 4,000 Dearborn workers to stay home, with downtime scheduled through Sept. 30.
Dearborn was not the only plant affected. Kansas City Assembly in Missouri lost F-150 shifts to the same supplier issue. "We've barely worked the last two weeks," said Jim Fisher, bargaining chair of UAW Local 249. The Deep Dive reports Ford has cancelled 15 F-150 shifts there since Sept. 1. Transit van production at the plant kept running.
CEO Jim Farley spoke to reporters on Sept. 30. "We are back up and running," he said, according to Reuters. "The supplier issue, you know, we have ways to address it. It is impacting our third-quarter wholesale. But I'm very optimistic." Ford has not said how large the wholesale impact is.
Ford has also not identified the supplier or the part. Spokesman Dave Tovar said the company does not comment on supplier disruptions, and Reuters reported that Farley did not name the supplier either. According to Reuters, the disruption has nothing to do with the Novelis aluminum problem, and Farley said Ford is "fully recovered" from the two fires at Novelis late last year.
Why buyers outside Detroit should care
F-Series trucks produce the bulk of Ford's profits, and Reuters reports F-Series sales were down 11% year over year through August 2026. CBT News puts dealer pickup supply at about 40 days, short of Ford's 50- to 60-day target. A supplier problem that Ford has never publicly described still managed to idle the company's most important product at two plants while inventory was already thin.
Yahoo Finance argued that because two plants were hit, the cause is probably one component deep in the supply chain. That is the outlet's own reading, not something Ford has said. It still describes a pattern any multi-plant manufacturer should check for: one input feeding several lines.
Ford has seen this before with a concentrated supplier. After the Novelis fires (the second one struck Novelis' Oswego, N.Y., plant on Nov. 20, 2025), Ford estimated the disruption could cost it $1.5 billion to $2 billion and 90,000 to 100,000 F-Series units in the fourth quarter of 2025, WardsAuto reported. Ford planned to recover about 50,000 of those units in 2026. Even with a recovery plan, roughly half the lost volume was never coming back.
Step 1: Find your single-source exposure
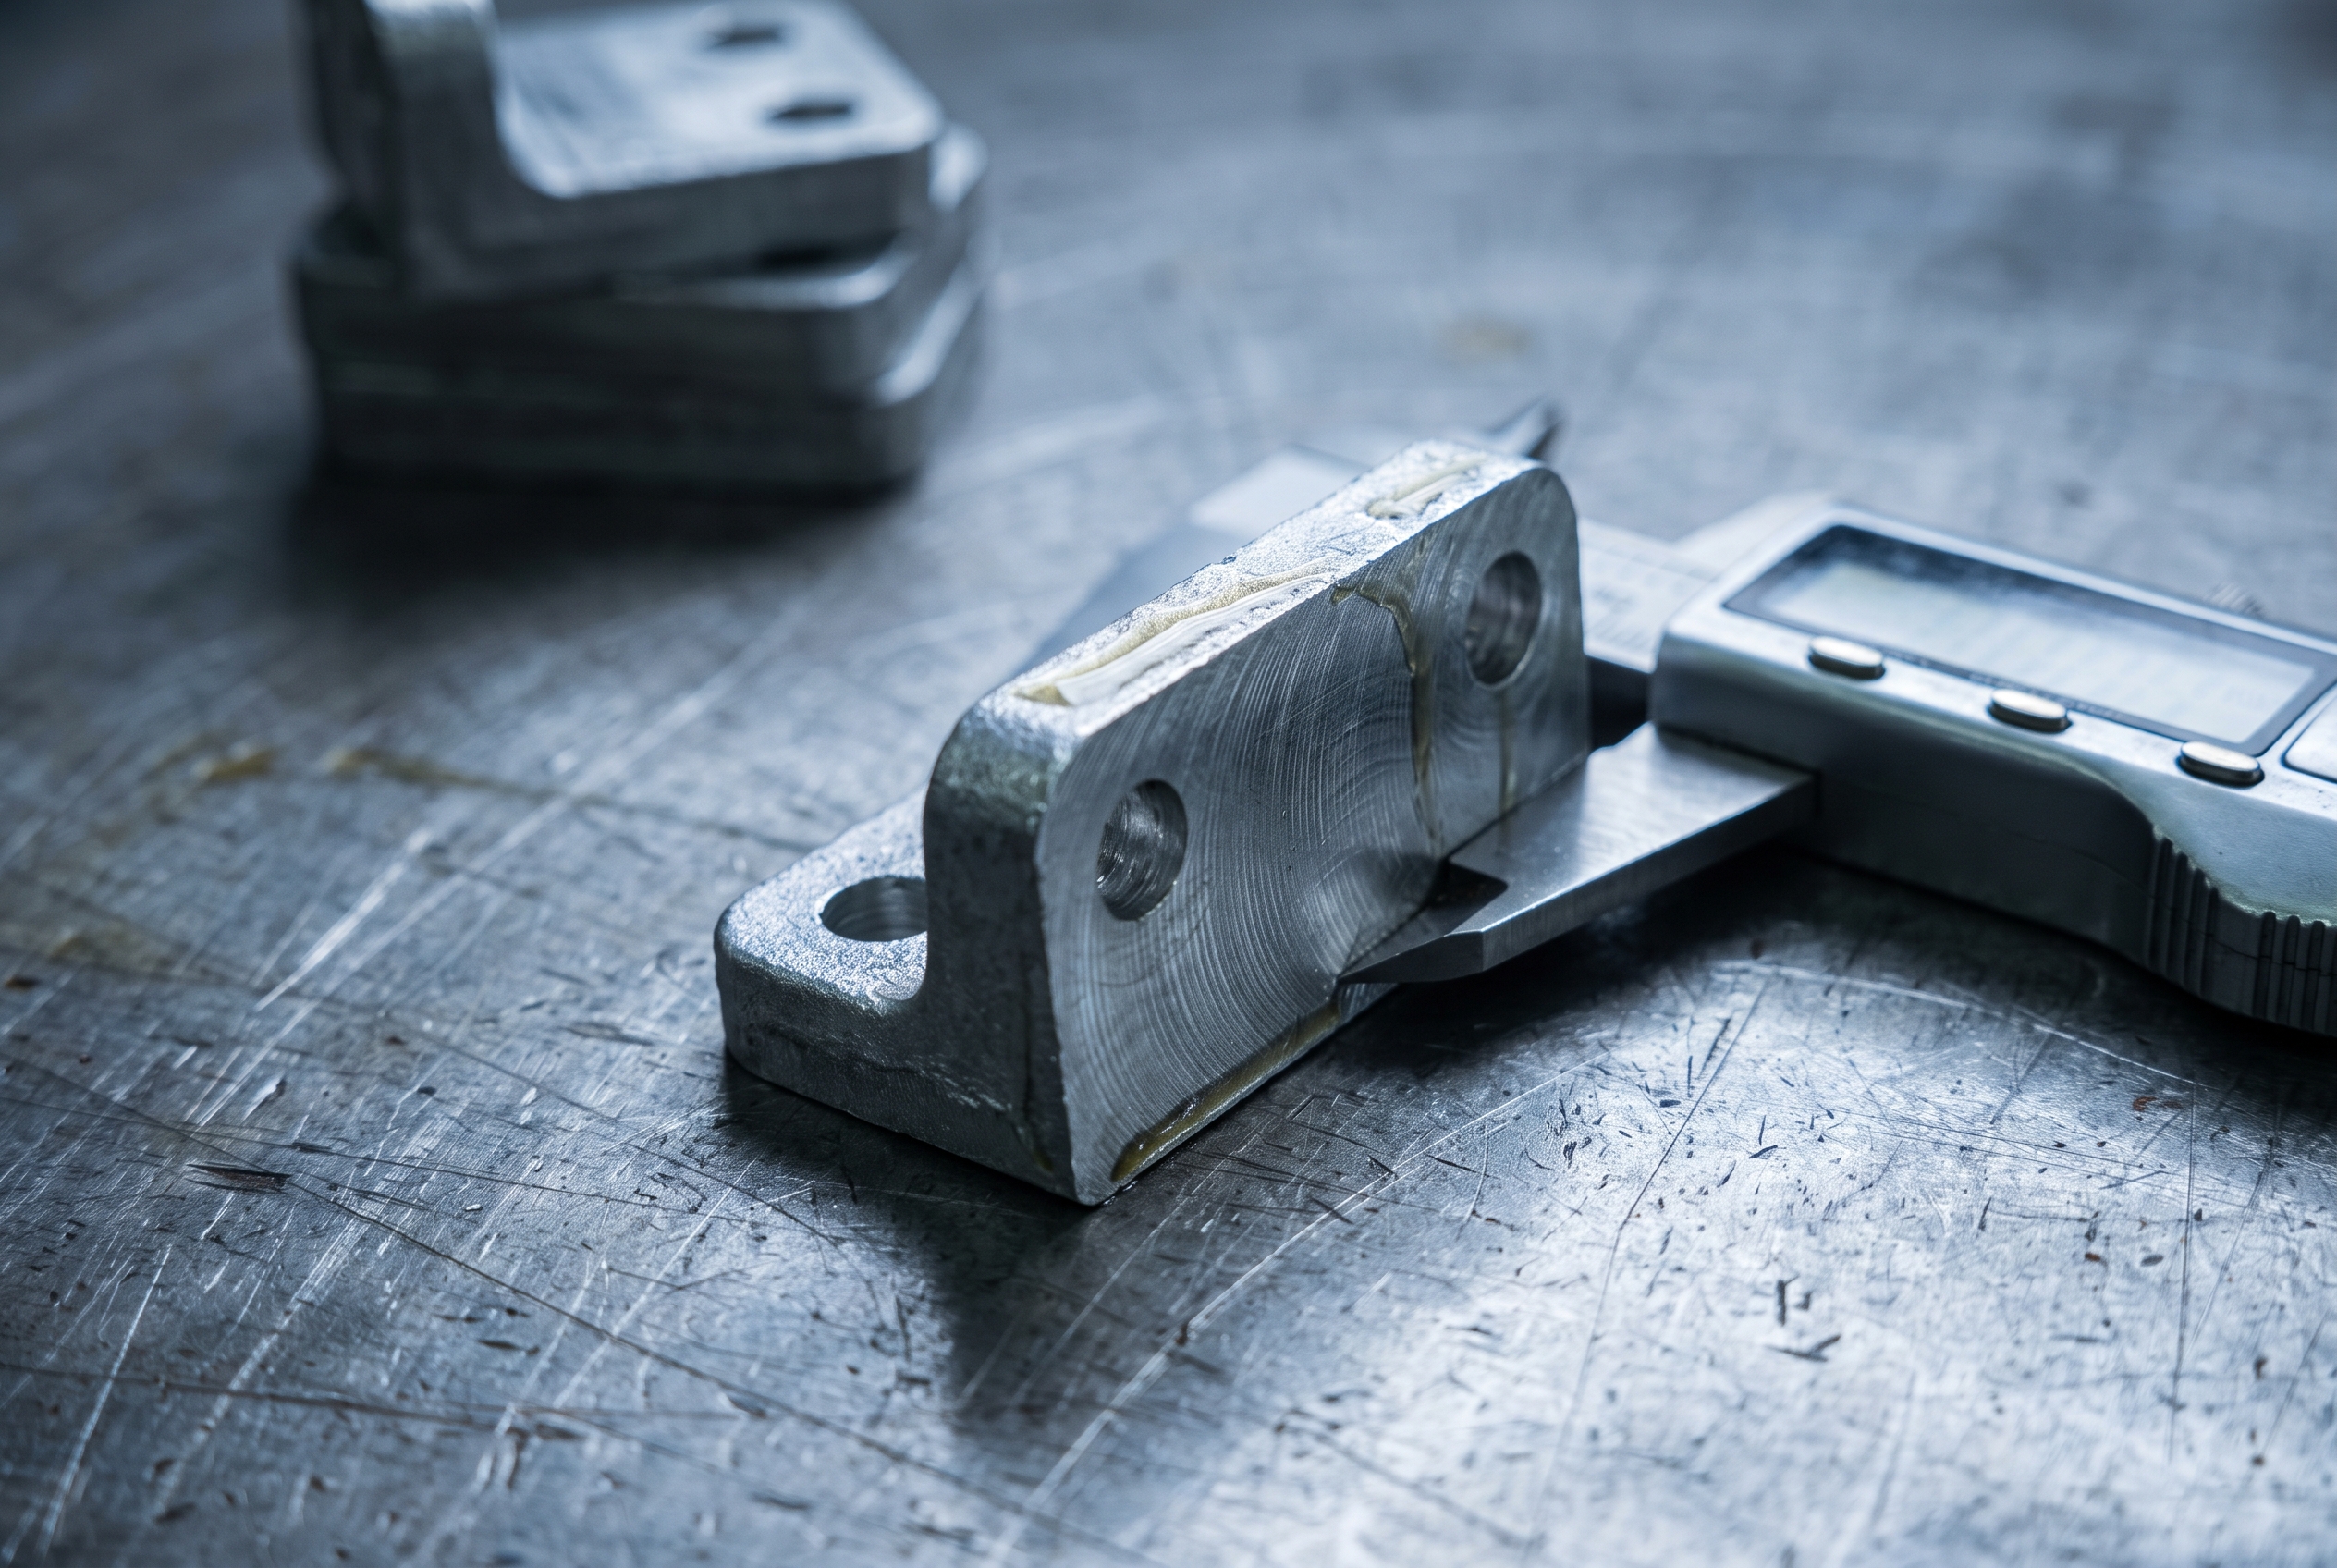
Go through the bill of materials one line at a time. Don't stop at the tier-1 part number. Ask each supplier where the critical sub-tier inputs come from: castings, resins, chips, coatings, fasteners, and heat treat or plating done by sub-contractors. Flag every item with only one approved manufacturing site.
Then split the flagged list in two:
-
Single-source: other capable suppliers exist, but you chose one, usually for price, volume leverage or a past qualification. These are the cheaper ones to fix.
-
Sole-source: only one supplier can make the part, often because of proprietary tooling, a patent or a specialized process. Here the realistic options are buffer stock, a second site at the same supplier, or a redesign.
Last, link each flagged part to every plant and product that uses it. A part feeding two final assembly lines carries twice the exposure of one feeding a single line, and its spend can look the same on paper.
Step 2: Rank parts by time-to-survive against time-to-recover
MIT's David Simchi-Levi built a risk method around two figures. Supply Chain Digest summarizes them this way:
-
Time-to-recover (TTR): "the time it would take for a particular node, a supplier facility, a distribution center, or a transportation hub, to be restored to full functionality after a disruption."
-
Time-to-survive (TTS): "the maximum duration that the supply chain can match supply with demand after a node disruption."
The method "was implemented successfully at Ford Motor Company," Simchi-Levi wrote in Harvard Business Review in 2015, and MIT News also reported its use at Ford. Supply Chain Digest reported that Ford "had hundreds of suppliers for which TTS was less than one week, meaning a supplier disruption would cause an almost immediate disruption to Ford's product supply capability." At the other end, some Ford suppliers had a TTS of about 50 weeks.
To use the method for each flagged part:
-
Estimate TTS yourself from on-hand inventory, in-transit stock, supplier finished goods you can actually claim, and any alternate part you could substitute without new approvals.
-
Ask the supplier for TTR covering a realistic bad case such as a fire, a press failure or a sub-tier outage. Discount the answer. Simchi-Levi warns that "Suppliers tend to be optimistic about the information that they provide."
-
Rank by the gap. When TTS is shorter than TTR, a disruption will stop your line. Those parts go to the top, regardless of how small the purchase order is.
Step 3: Put a dollar figure on the stop
You need a cost before you can justify a fix. ManufacturingMag's downtime cost calculator asks for six inputs: stopped hours per incident, saleable units per hour, contribution per unit, output not recovered (%), incremental recovery cost per incident, and incidents per month. The formula is lost contribution (stopped hours × saleable units per hour × contribution per unit × unrecovered output share) plus incremental recovery costs, multiplied by monthly incident frequency.
Use the inputs carefully:
-
Contribution, not revenue. The calculator defines contribution as selling price minus variable costs. Plugging in revenue overstates the loss.
-
A realistic unrecovered share. Overtime and Saturday shifts can win back some output, but not when demand is lost, capacity is already full, or the customer has resourced the work.
-
Incremental recovery costs. Count expedites, premium freight, overtime premiums and sorting or rework.
Worked example (hypothetical numbers): a mid-market assembler loses 16 hours on a line that ships 30 saleable units an hour at $400 contribution each, and expects to recover 60% of the lost output on overtime. Lost contribution is 16 × 30 × $400 × 40% = $76,800. Add $25,000 for premium freight and overtime premiums and one incident costs $101,800. Enter one incident per month in the calculator to get that per-incident figure, then multiply by your own estimate of how often such an event happens each year. At an assumed one event every two years, expected annual cost is about $50,900.
The calculator leaves out safety impacts, penalties, customer loss and cascading effects unless you enter them. For a part that feeds several lines, those cascading effects may be most of the bill. It runs locally in your browser.
Step 4: Choose a fix for each part
There are four options. Compare each one's annual cost against the expected stop cost from Step 3.
-
Buffer stock sized so TTS is longer than TTR. This follows directly from the Simchi-Levi method. Carrying cost is the price. In the hypothetical above, three extra weeks of a part with $600,000 in annual spend ties up about $34,600, and at an assumed 20% carrying rate that costs roughly $6,900 a year, well under the $50,900 expected loss. Buffers fail when TTR is long, as with a fire, or when the part has a shelf life.
-
A dual-qualified second source. This costs the most up front and usually means splitting volume, which can cost you price leverage. It is the only fix that holds when TTR runs to months.
-
A second site at the same supplier. Qualification is faster, but you stay exposed to anything that hits the whole company, such as financial distress, a labor dispute or a shared sub-tier input.
-
Accept the risk. This is a reasonable choice when TTS already exceeds TTR or the expected stop cost is small. Write down the decision and its owner.
Step 5: What qualifying a second source involves
In automotive and many other supply chains, the gate is the Production Part Approval Process. PPAP was developed by the Automotive Industry Action Group (AIAG) as part of APQP. According to the Wikipedia summary, approval is required "whenever a new or modified component is introduced to production, or the manufacturing process is changed," and "may also be required if components are processed by external sub-contractors." Quality-One says it more simply: "A PPAP is required for any new part submission as well as for approval of any change to an existing part or process."
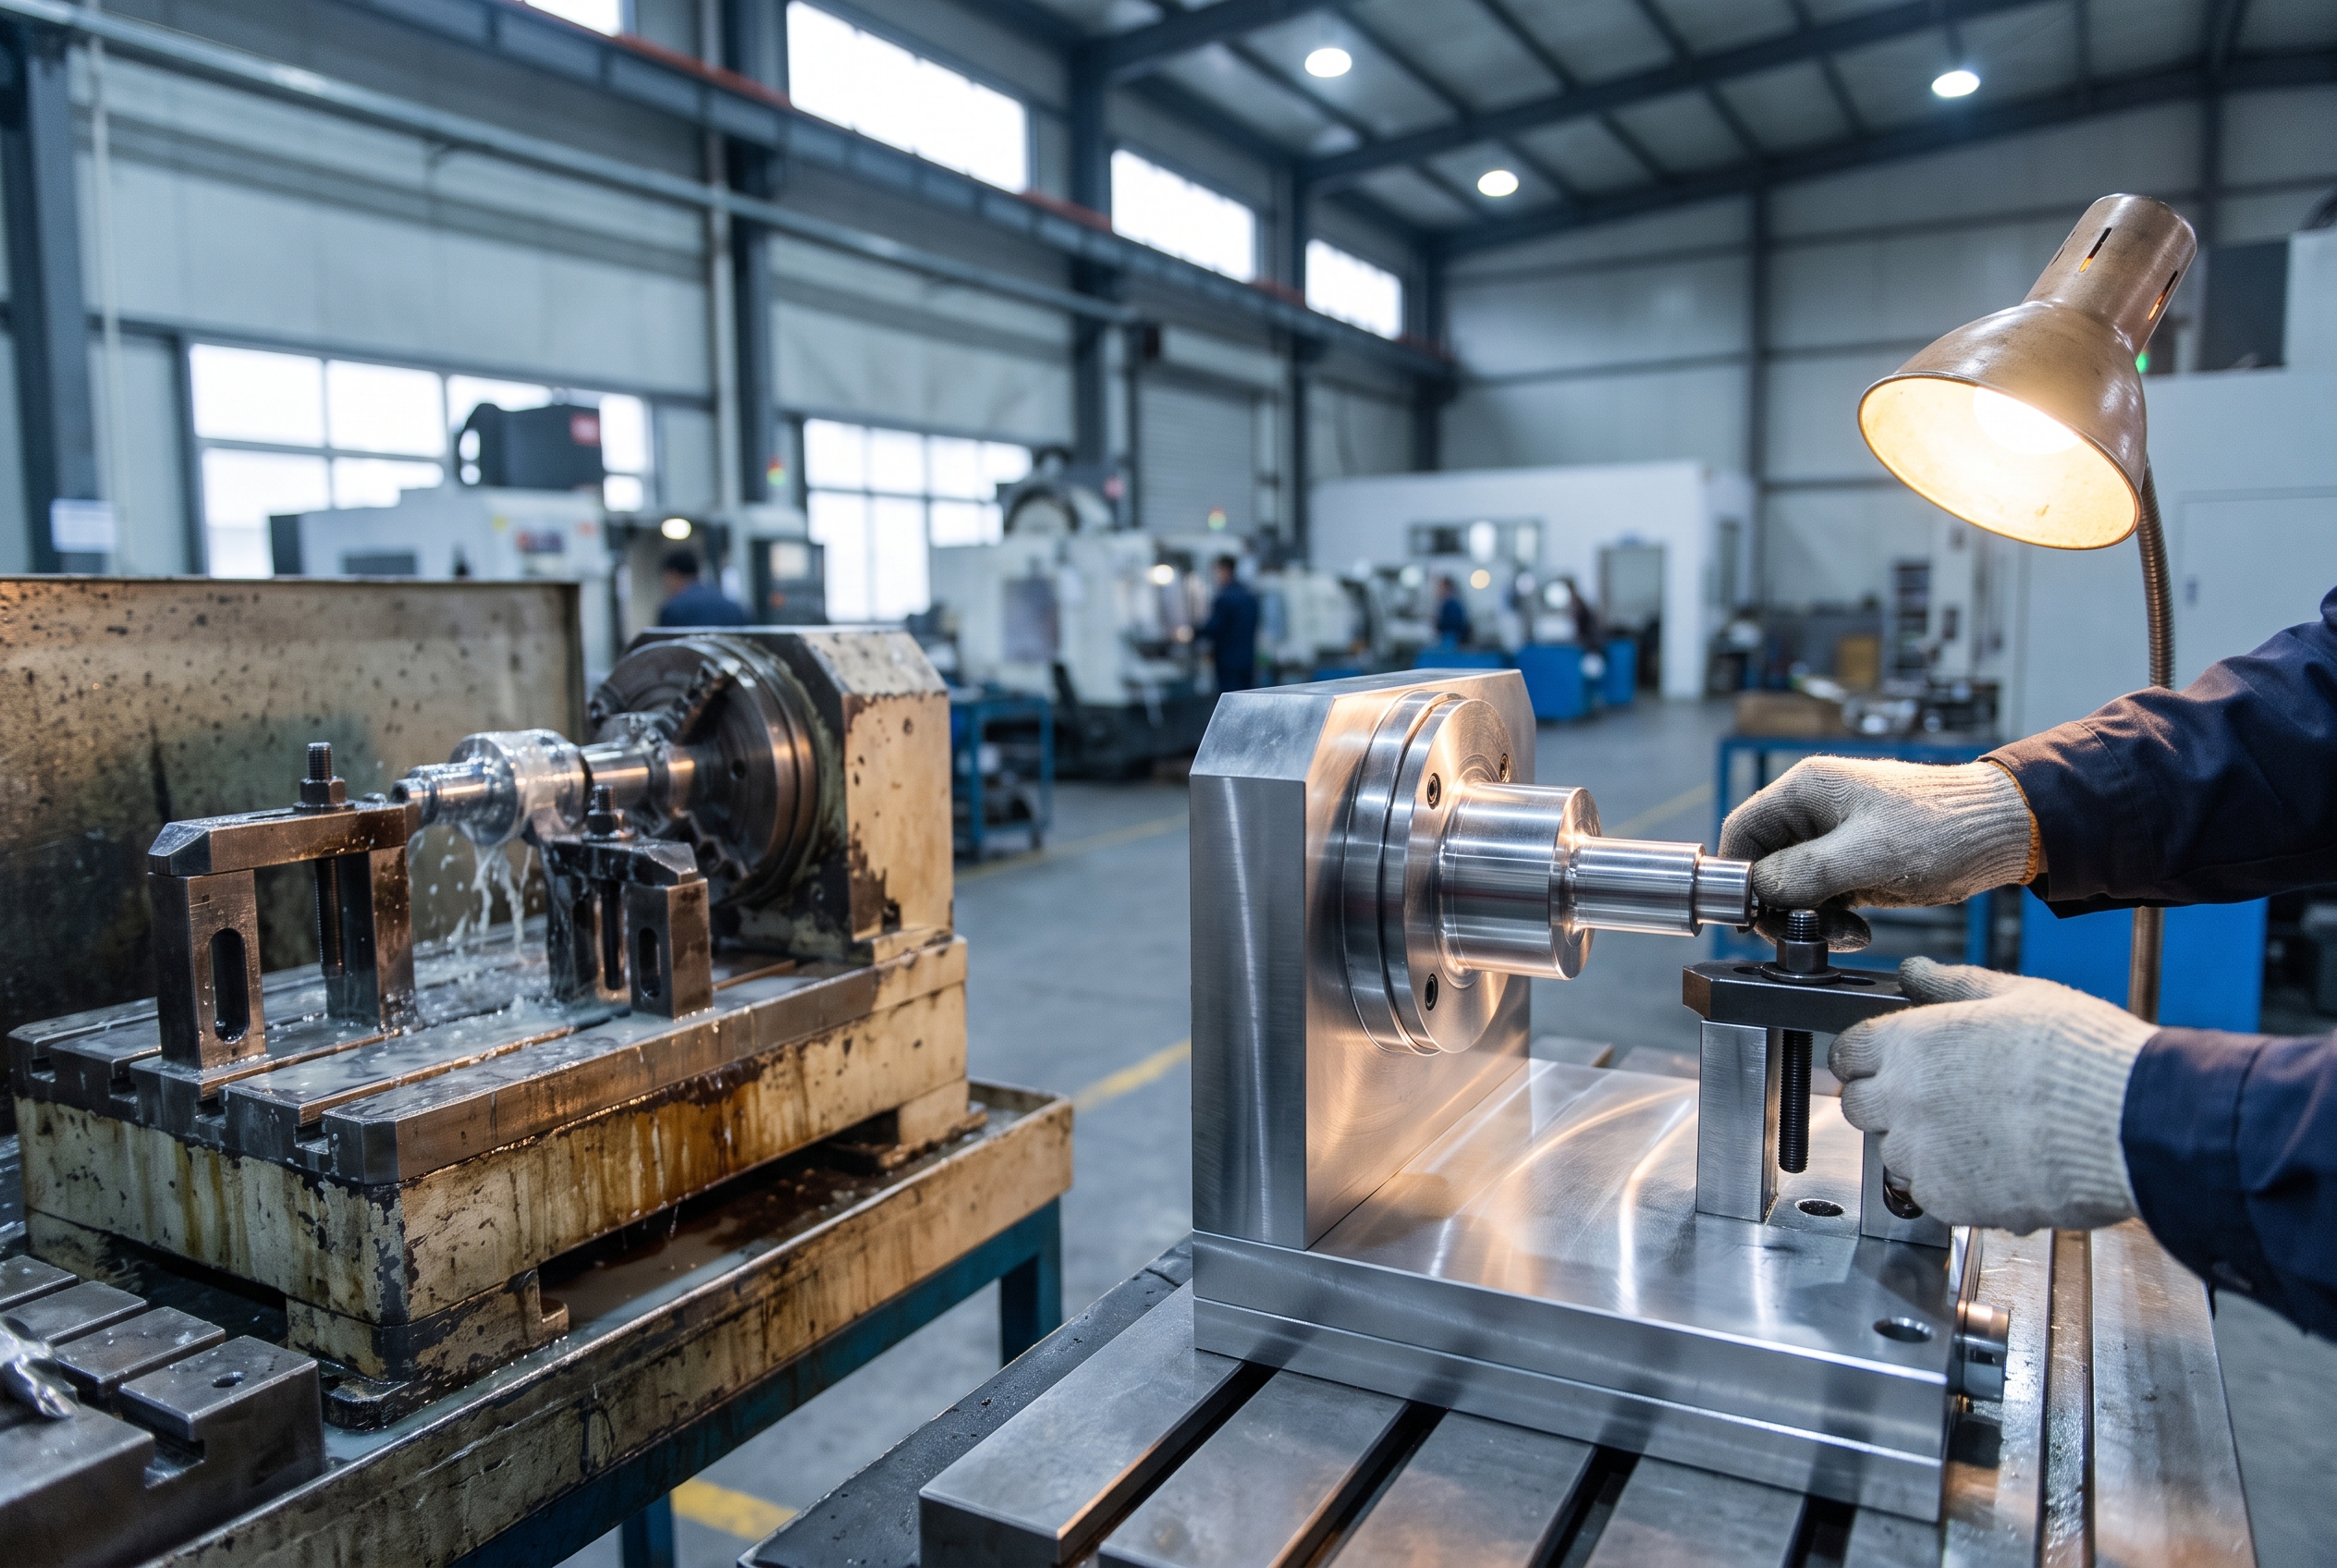
There are five submission levels. Level 1 is a Part Submission Warrant (PSW) alone. Level 5 is a PSW with complete data available for review at the supplier's site. Your customer's requirements set the level, and with it how much documentation and time you need.
Budget for these items before you start:
-
Tooling and fixtures at the new source
-
Sample runs and dimensional layouts
-
Measurement system analysis (MSA)
-
Process capability studies
-
Your customer's review and approval time, which you don't control
Start qualification while nothing is wrong. Qualifying a source in the middle of a stoppage means the PPAP timeline gets added to your recovery time.
Single-source parts checklist
-
Flag every BOM line, sub-tier inputs and outside processing included, that has one approved manufacturing site.
-
Classify each as single-source (a choice) or sole-source (one capable supplier).
-
Map each flagged part to every plant and product it feeds.
-
Estimate TTS from your own inventory and pipeline data.
-
Get supplier TTR for a realistic bad case and discount it.
-
Rank parts by the TTR-minus-TTS gap.
-
Cost a stop with the downtime cost calculator using contribution margin, a realistic unrecovered share and recovery costs.
-
Choose buffer, second source, second site or accepted risk, and record the owner.
-
For any new source, set the PPAP level, budget and timeline with your customer.
-
Review the list quarterly and whenever a supplier changes sites, sub-tiers or ownership.
The open question for your own plant
Ford says the supplier issue has been dealt with and that Farley is "very optimistic." It has still not said what failed or where. For everyone else, what matters is which parts on your own BOM have a time-to-survive under a week, and whether anyone has checked the supplier's recovery estimate against reality. That list can be built this quarter, before a stoppage forces it.
Related reading
Sources
-
The Deep Dive: Ford's F-150 Line Sits Idle In Michigan As Its Canadian Super Duty Plant Nears Launch
-
CBT News: Ford's Farley says F-150 supplier issues are fixed
-
Yahoo Finance: Ford (F) Halts F-150 Production at Dearborn Over a Supplier Problem
-
WardsAuto: Ford faces up to $2B quarterly hit from Novelis plant fire
-
Harvard Business Review (David Simchi-Levi): Find the Weak Link in Your Supply Chain
-
MIT News: Risk Exposure Index used by UN Office for Disaster Risk Reduction