US industrial robot installations rose 12% in 2025 to about 38,400 units, according to the International Federation of Robotics' World Robotics 2026 report, released September 24, 2026. That moved the United States past Japan into second place worldwide, behind China. The growth did not come from the auto industry. Automotive, still the largest buyer, was flat. The additional robots went to food plants, warehouses, logistics operations and medical manufacturers.
For operators and investors, the mix matters more than the total. It shows which applications US buyers now think will pay back, and it suggests where the next round of automation capex is headed.
The numbers in context
IFR reports the US figure two ways. Its US-specific release gives 38,400 units. Its global release rounds that to "almost 38,500 units." It is the same data rounded differently. The September numbers replace IFR's preliminary June 18 estimate of 38,000 units and 11% growth.
IFR President Jane Heffner called 2025 "the third strongest year on record behind 2018 and 2022" for the US. The broader picture:
-
World: 603,000 installations, up 11%. The operating stock rose 9% to a record 5 million units. "The new mark of five million robots operational in factories worldwide is more than double the number seven years ago," Heffner said.
-
China: 354,000 units, up 20%. That is 59% of global installations and almost 60,000 units above China's previous record.
-
Japan: 36,219 units, down 19%, which dropped it to third behind the US.
-
Republic of Korea: 30,000 units, down 1%.
-
Germany: 24,842 units, down 8%, which is 41% of EU installations.
-
European Union: 60,500 units, down 11%, according to IFR data reported by The Next Web.
Among the large markets outside China, the US grew while Japan and Europe shrank.
Who bought the robots
IFR's September release gives three US industry figures for 2025:
| Industry | 2025 installs | Change | Approx. share of US total* | | --- | --- | --- | --- | | Automotive | 13,500 | -1% | 35% | | Metal and machinery | 3,000 | -15% | 8% | | Food and beverage | 2,900 | +30% | 8% |
*Our calculation from IFR figures, based on about 38,400 total US installs.
"Growth came from the food industry and sectors like warehousing, logistics or medical. At the same time automotive has stayed stable as the largest customer," Heffner said in the US release.
Together the three named industries account for about 19,400 units, roughly half the US total. The September release does not break down the other half. IFR's June preliminary data offers some detail: it put electrical and electronics at about 3,000 units, and Manufacturing Dive's report on that data said installations in non-manufacturing areas grew 41%. Much of the growth therefore sits in categories that most plant-floor benchmarking ignores.
Why food and logistics
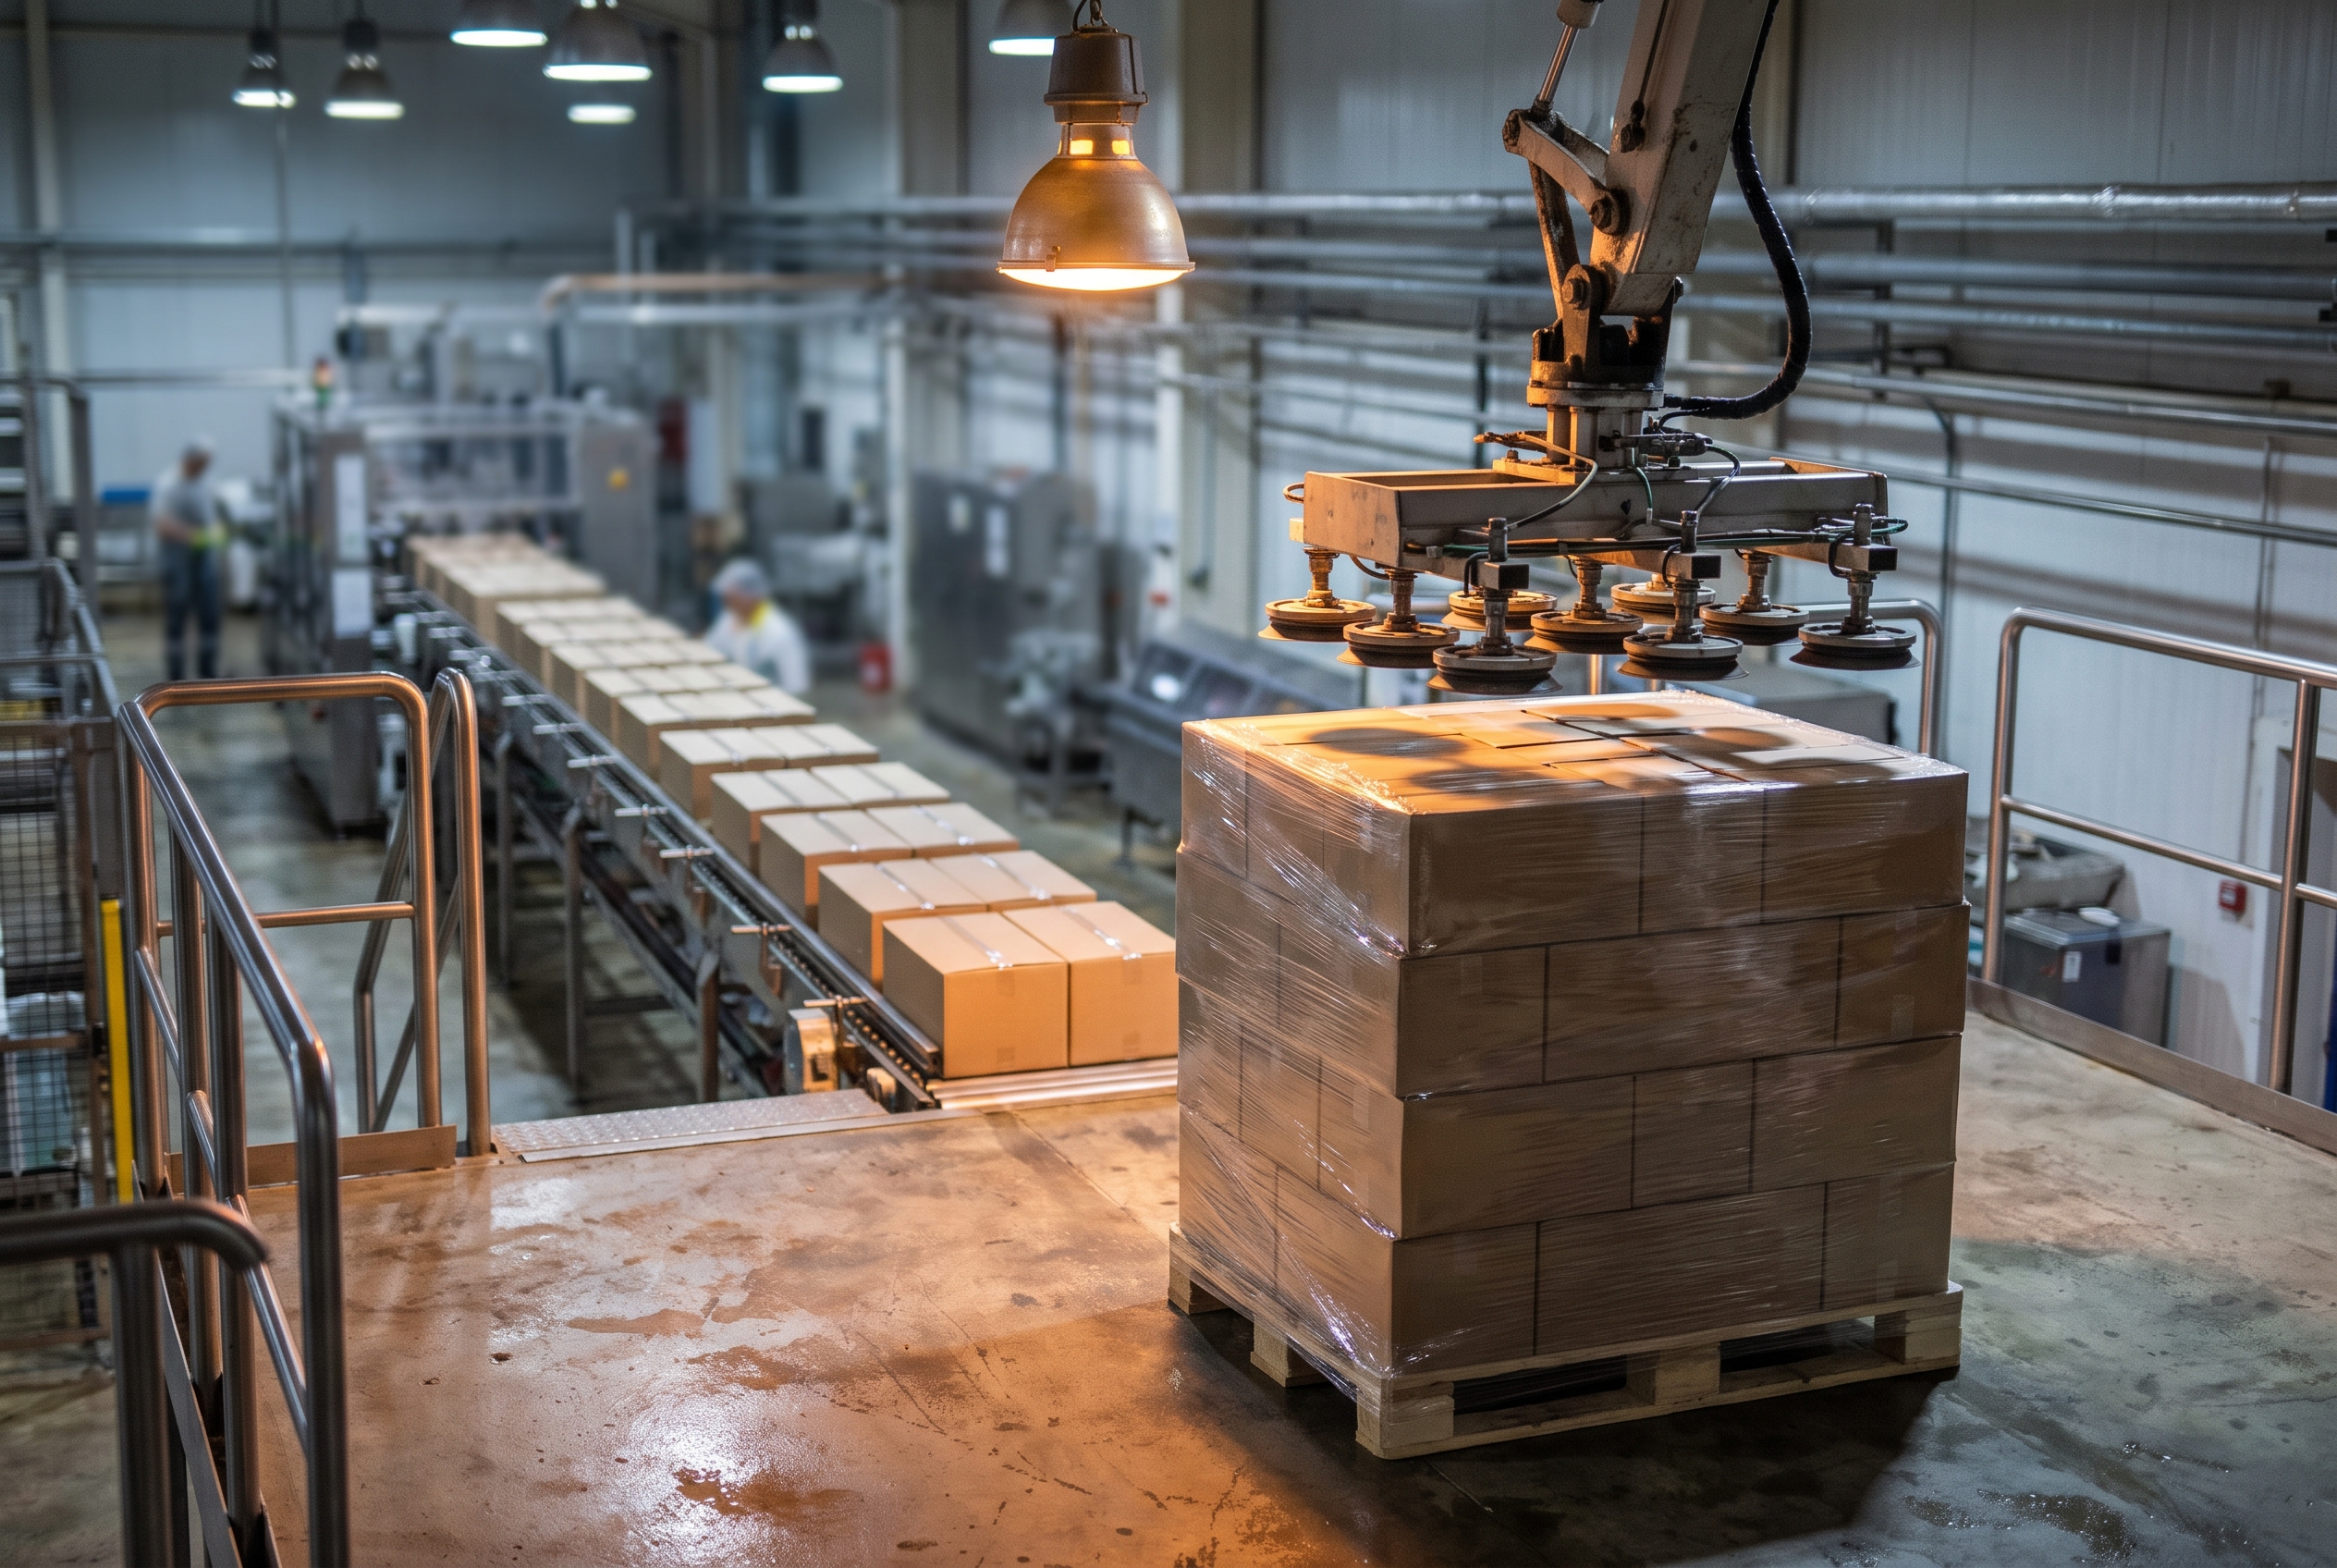
This section is our analysis, not IFR data. Food, warehousing and logistics have a lot of repetitive end-of-line work: palletizing, case packing, case handling and tray loading. Labor turnover in these jobs is high. Modern grippers and vision systems can handle a wide product mix in these tasks, so the business case no longer requires the long, stable runs that justified the classic automotive body-shop cell. When a plant keeps rehiring for the same palletizing job, the robot's payback depends on turnover and training costs as well as wages.
Order data from the Association for Advancing Automation (A3) points the same way. A3 counted 36,766 robots ordered in North America in 2025, worth $2.25 billion. Units rose 6.6% and revenue 10.1%. A3 says non-automotive demand outpaced automotive, and orders for automotive components stayed below 2024 levels. These are orders rather than installations, and they cover North America rather than the US alone, so they do not reconcile directly with IFR. The direction matches, though.
Collaborative robots are part of this shift. A3 counted 7,212 cobots ordered in 2025, worth $241 million. That is 19.6% of units but only 10.7% of revenue. Q4 2025 brought 2,953 cobot orders, the highest quarterly volume since A3 began tracking cobots separately. Alex Shikany, A3's executive vice president, said "the rebound in robot orders over the course of 2025 reflects renewed confidence," meaning confidence that automation can address workforce shortages and raise productivity.
What the flat auto number tells you
US automotive installs fell 1% to 13,500. Elsewhere the auto picture moved sharply. According to IFR data reported by The Next Web, China's automotive installs rose 38% to a record 78,900 and EU automotive installs fell 25% to 14,900. Brazil's automotive installs rose 212% to almost 2,100, which IFR attributes to investment by Chinese carmakers.
Against those swings, the US auto sector held steady rather than expanding. The data does not show where recent US EV and battery investment went in robot terms, and we will not guess. For suppliers to auto OEMs, the practical point is that auto-driven robot demand did not grow in 2025. Integrators and robot vendors are pursuing work in food, logistics and medical, which affects their pricing and how much capacity they have for your project.
Capex under a labor constraint
IFR's US outlook links the investment case to labor: "Uncertainty and trade tensions will be a burden in the short term, but reshoring policy and labor scarcity will provide excellent opportunities for robotics in the long run."
The labor constraint is visible in federal data. US manufacturing job openings stood at 608,000 in July 2026 (BLS JOLTS via FRED, not seasonally adjusted). Robot density shows how much room is left. IFR's April 2026 density report, based on 2024 data, puts the US at 307 robots per 10,000 manufacturing employees, eighth in the world. Germany has 449, Japan 446 and Korea 1,220. A record installation year does not close a gap that large quickly.
What a robot costs a mid-market buyer
A3's figures give a rough price benchmark. By our calculation, the average order value in 2025 was about $61,000 per robot overall and about $33,000 per cobot. Excluding cobots, the average for the remaining robots works out to about $68,000.
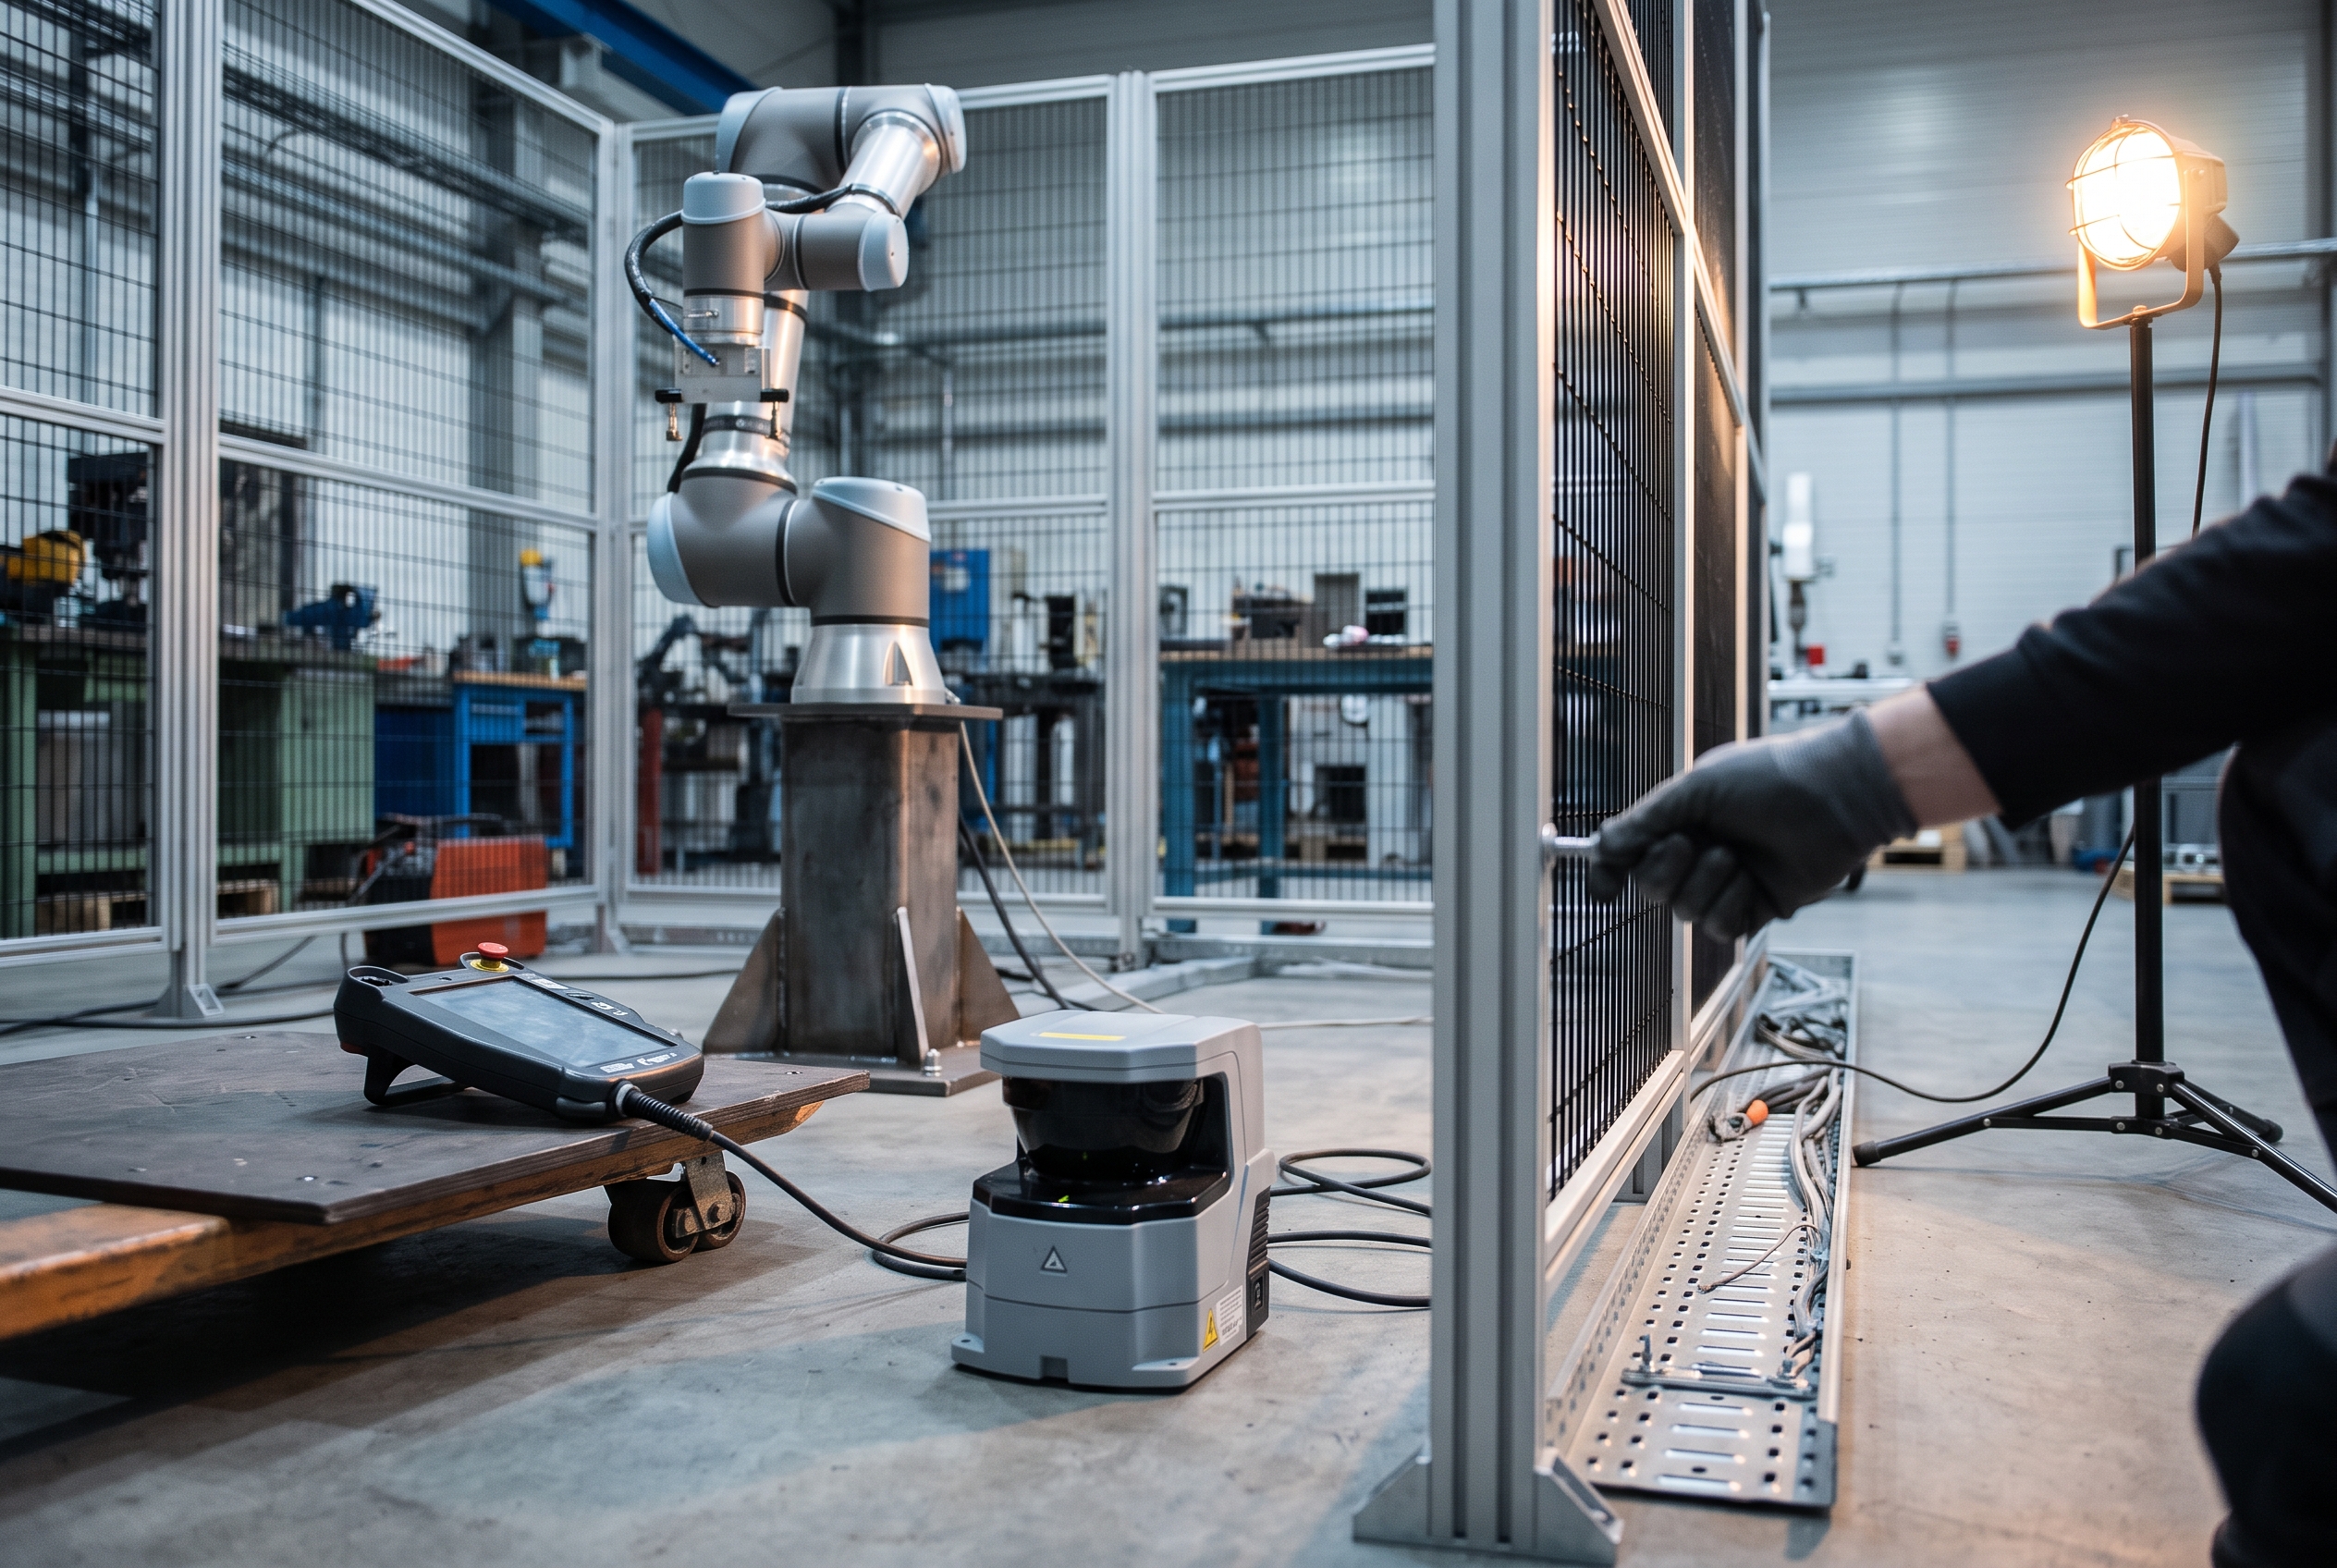
These figures cover the robot only. A working cell also needs:
-
Integration and programming, usually through a system integrator
-
End-of-arm tooling, fixtures and vision
-
Guarding, safety scanners and risk assessment, including for many cobot applications once the payload or task requires it
-
Lost output during installation, commissioning and ramp-up
-
Training for maintenance and operators
Commissioning downtime is the cost buyers most often leave out of the justification. If the cell replaces manual work on an existing line, the line may run slowly or stop while the robot is installed and debugged. Our free downtime cost calculator separates lost contribution margin from incremental recovery costs such as overtime and expediting. Use it to put a number on commissioning and changeover time before you sign.
Supply side: imports, integrators and service
IFR says most robots installed in the US are still imported from Japan and Europe. Several American robot makers have emerged, and there are many domestic system integrators. In China, domestic suppliers held 55% of their home market in 2025 (195,000 units), down from 57% in 2024.
For a buyer, import reliance matters less for tariff speculation than for day-to-day operations: spare-parts lead times, where service technicians are based, and whether the integrator has trained staff for the specific brand. Put spare-parts availability and response times into the service contract, not just the quote.
Elsewhere in the Americas
IFR's regional figures matter for nearshoring decisions:
-
Mexico: fewer than 5,200 installs, down 7%, the third straight annual decline.
-
Canada: almost 4,000, up 5%.
-
Brazil: almost 4,300, up 38%, driven by Chinese carmakers' automotive investment.
If a sourcing plan assumes Mexican suppliers are automating quickly to offset labor costs, the installation data for 2025 does not support that assumption. Ask suppliers about their automation directly during qualification.
Outlook and what to do
IFR forecasts global installations will rise 9% to 655,000 in 2026 and reach 806,000 by 2029. According to The Next Web, IFR expects 2026 growth of 11% in Asia, 2% in the Americas and 0% in Europe. After the 2025 jump, US volume is expected to grow slowly.
For a plant considering its first or next cell, the 2025 data points to a clear starting place: repetitive end-of-line work where turnover is high and the task is easy to define, such as palletizing, case packing and machine tending. Before signing, benchmark three things: the fully loaded cost of the cell compared with the robot price, commissioning downtime at your contribution margin, and the vacancy and retraining cost of the job the cell will cover. If the business case works only on wage savings, it probably depends too heavily on staying fully staffed.
Related reading
Sources
-
IFR: Five Million Robots now Operate in Factories Globally (Sept 24, 2026)
-
IFR via Business Wire: U.S. Now Second-Largest Robotics Market, Following China (Sept 24, 2026)
-
IFR: US Robot Industry Returns to Double Digit Growth (June 18, 2026)
-
The Next Web: China installs 59% of new factory robots as EU installations fall 11% (Sept 24, 2026)
-
IFR: Robot Density Surges in Europe, Asia, and Americas (April 8, 2026)
-
The Robot Report: North American robot orders rise by 6.6% in 2025, reports A3 (Feb 7, 2026)