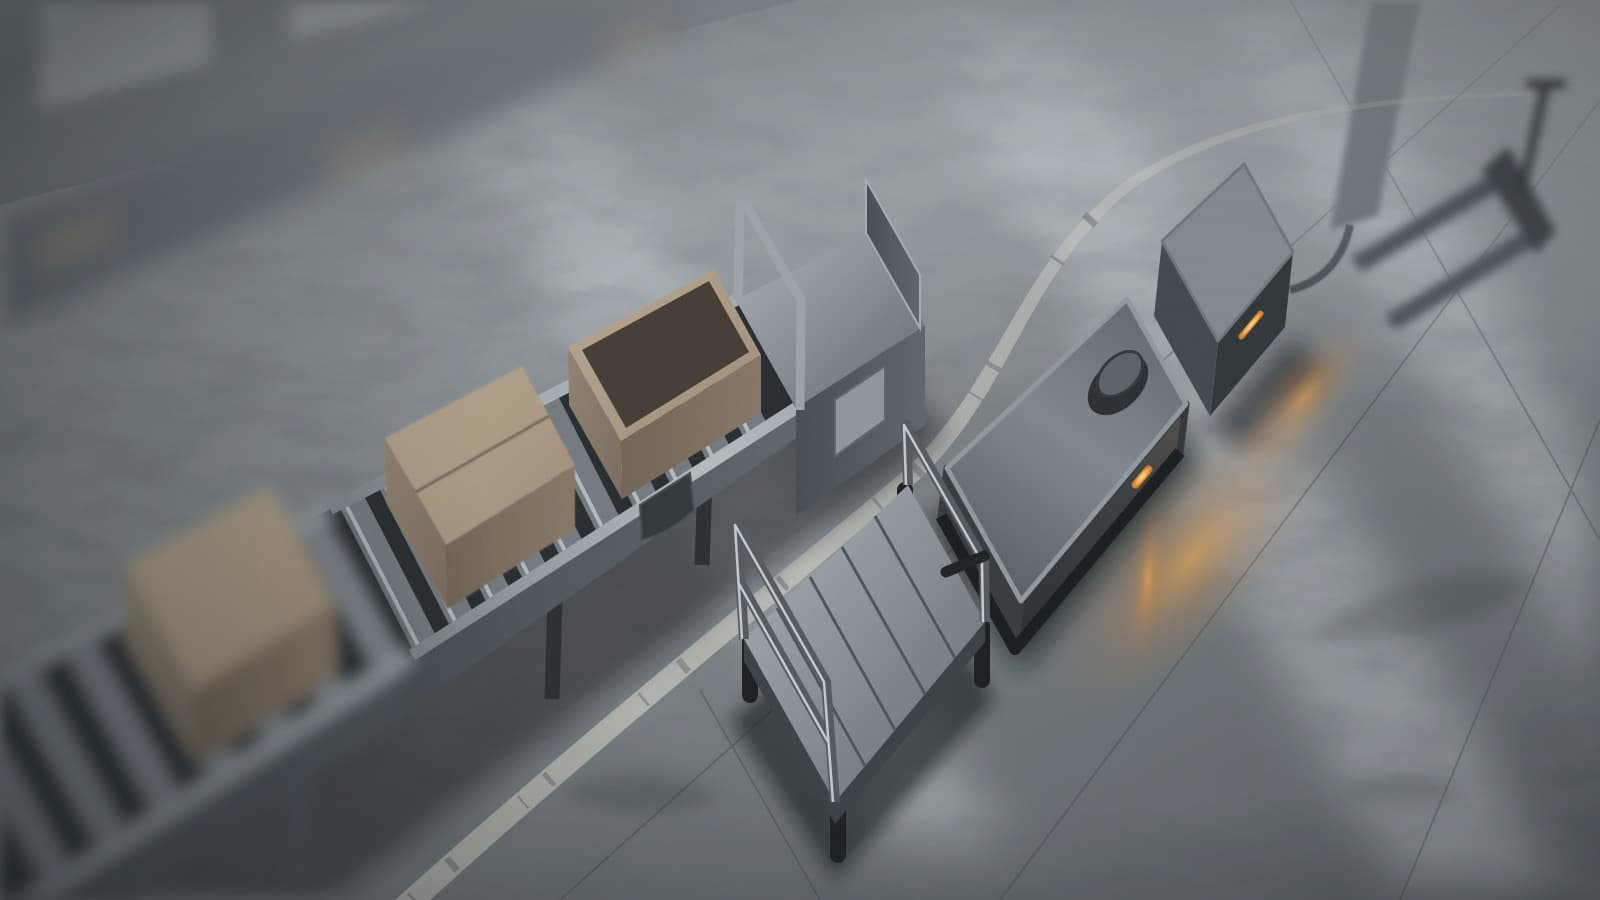
In an AMR vs conveyor decision, a conveyor's cost per move keeps falling as volume rises, while AMR cost climbs one robot at a time and has a floor. Conveyors tend to win on fixed, high-volume routes. AMRs can win at low volume per route, or when the route will change before the conveyor pays out.
A plant weighing the two usually has one route, a quote from each side and two sales decks that cannot both be right. Our research found no independent study measuring cost per move for both systems on the same plant material flow. Every dollar figure below comes from a vendor, integrator or financing intermediary unless it is marked as editorial arithmetic. We did not test either system, so the useful product here is a worksheet you can fill in with your own quotes and your own cycle times.
Who is claiming what
The conveyor case comes most clearly from Cisco-Eagle. In a September 2023 comparison, Scott Stone, its VP of Marketing, wrote: "On a cost-per-unit moved basis, AMRs tend to be more expensive," and "A conveyor that is used consistently over a long shift will move that load more economically than an AMR-based strategy." The article gives no numbers, and Cisco-Eagle has a stake: Hytrol's site records a 50-year partnership between the distributor and the conveyor maker.
The same article concedes real ground. It says "Conveyors cost more to install than AMRs" and "AMRs are easier to reconfigure than fixed-layout conveyor systems." It also says AMRs tend to have greater IT and software integration needs. A January 2023 Cisco-Eagle post leans the other way on upfront cost: "Conveyors are less expensive to purchase than AMRs or AGVs, but may have more extensive maintenance costs." So the same company has said conveyors cost more to install and less to purchase. Treat neither line as a rule for your project.
The AMR case comes from OTTO's January 2021 blog, now published under Rockwell Automation. It reports a study by its partner PULSE Integration finding that a single AMR represents "50% of conveyor costs" and that "a single OTTO 100 unit could do the work equivalent to a 250 LF conveyor." OTTO adds that the saving "was based on optimum loads." The sites were a 700,000 sq ft brownfield and a 1 million sq ft greenfield. The page states no fleet size, payloads, discount rate or maintenance cost.
Read the qualifiers side by side. "Used consistently over a long shift" and "based on optimum loads" are both conditions on the load profile, and each favors the seller making the claim. Both statements can hold, in different plants.
Payback claims need the same care. OTTO says ROI on large-scale deployments under a system lease "could be under 12 months," that a vehicle-only lease pushes it to 12-24 months, and that capital purchases "would be typically paid for in two years or less." Integrator AMD Machines says AMR fleet payback "typically runs 14 to 24 months." It also shows a conveyor at $280,000 installed paying back in about 14 months against $232,000 of annual labor, four handlers at $58,000 fully burdened. That is a labor-displacement case. It says nothing about a conveyor against an AMR.
Why the two cost curves differ
A conveyor is mostly a fixed cost. Once it is installed, each added move spreads the same annual cost more thinly, so cost per move keeps falling as volume rises.
An AMR fleet is a staircase. Each robot adds a block of cost and a block of capacity. A fully used robot sets a floor that fleet growth cannot get below:
AMR floor per move = annual cost per robot ÷ annual moves per robot
This shape means the break-even tends to sit at a robot-capacity step, where one more move forces one more robot. It also means a single cost-per-move figure from any seller is incomplete without the volume behind it.
The word "move" also needs defining. A conveyor moves single items in a continuous stream, while an AMR may carry a cart or pallet of many. Cisco-Eagle makes the throughput point directly: conveyors "can move more, faster than either AMRs or AGVs," while "throughput isn't why you deploy mobile robotics." Normalize both options to cost per unit moved, which is cost per move divided by units per move. As a hypothetical, a $0.63 AMR trip carrying 20 totes works out to about 3 cents a tote, which beats a conveyor costing $0.20 per tote. Count moves differently and the ranking can flip.
What goes in each line
Hytrol's total cost of ownership framing is a fair starting point for both options: equipment, maintenance and operating costs divided by useful life. The lines themselves differ.
| Cost line | Conveyor | AMR |
|---|---|---|
| Hardware | Equipment, spares | Robots, chargers, batteries |
| Installation and integration | Install, controls, electrical | Fleet software, IT integration, Wi-Fi and floor fixes |
| Running cost | Energy, maintenance labor | Maintenance, software fees, capacity lost to traffic |
| Safety upkeep | Inspection and maintenance under ASME B20.1 | Reviews, training and management of change under R15.08 Part 3 |
| End of route | Removal, stranded capital | Redeployment, vendor continuity |
Two lines are easy to underprice. On conveyors, Bay Street Lending, a financing intermediary, says equipment is often only 50-65% of the budget. By our arithmetic, that turns a $100,000 equipment quote into roughly $154,000 to $200,000 all in.
On AMRs, the exposure sits in the building. Joshua Joseph, an AMR deployment engineer at Tesla, wrote in July: "The robots are fine. The deployment isn't." Joseph's examples include a Wi-Fi dead zone behind a press line and forklift operators who do not yield, each "a plant infrastructure problem, not a navigation problem."
Safety compliance adds recurring plant-side work on the AMR side. The R15.08 series for industrial mobile robots is now complete, with Part 1 covering the robots, Part 2 systems and applications, and Part 3 continued use. Trade press reported Part 3 available in early October 2026. It covers risk assessment, management of change, employee training and periodic reviews and inspections. Conveyors fall under ASME B20.1-2024, which covers design, construction, installation, maintenance, inspection and operation, and does not apply to automatic guided vehicles. Put hours against these tasks on both sides.
The worksheet
Gather seven inputs for one route: route length, moves per hour, operating hours per year, measured AMR cycle time, units per move, expected route life and an installed quote from each side. Then work through these steps.

-
Moves per robot-year: (60 ÷ cycle time in minutes) × operating hours per year.
-
Annual moves: moves per hour × operating hours per year. If demand peaks, size the fleet against the peak hour, since the annual average will understate robots needed.
-
Robots needed: annual moves ÷ moves per robot-year, rounded up.
-
Annual cost per robot: all-in cost ÷ robot life, plus annual running cost. If leasing, use the annual payments plus any costs they exclude.
-
Annual conveyor cost: installed cost ÷ the shorter of asset life and route life, plus annual maintenance and energy. Add removal cost if the route will end early.
-
Cost per move: annual cost ÷ annual moves for each option, then divide by units per move.
-
Break-even: divide annual conveyor cost by annual cost per robot and keep the whole number. Multiply that number by moves per robot-year. If the whole number is zero, the AMR does not win on cost on that route.
This sheet suits one route or a few. OTTO itself says small robot-to-robot and robot-to-human interactions "add up and can significantly impact traffic flow and fleet sizing," and that larger projects make fleets harder to size with spreadsheet methods. A multi-route fleet needs simulation.
A worked example
The numbers below are illustrative editorial arithmetic built on stated assumptions. They are not field data or benchmarks.
-
Conveyor A: $62,500, for 250 ft at $250 per foot. Ten-year straight-line life plus 5% of capex a year for maintenance and energy gives $9,375 a year.
-
Conveyor B: $280,000, AMD's installed example, on the same terms, gives $42,000 a year.
-
AMR: $100,000 all in per robot, five-year life, $10,000 a year to run, gives $30,000 a year per robot.
-
Operations: a five-minute effective cycle, or 12 moves per robot-hour. Two 8-hour shifts over 250 days give 4,000 operating hours and 48,000 moves per robot-year.
-
Excluded: cost of capital and labor. The model is pre-tax.
| Moves a year | Moves an hour | Robots | AMR per move | Conveyor A per move | Conveyor B per move |
|---|---|---|---|---|---|
| 12,000 | 3 | 1 | $2.50 | $0.78 | $3.50 |
| 48,000 | 12 | 1 | $0.63 | $0.20 | $0.88 |
| 200,000 | 50 | 5 | $0.75 | $0.05 | $0.21 |
The AMR floor in this model is $0.625 per move. The staircase shows up immediately past capacity: at 48,001 moves a year the route needs two robots, and AMR cost jumps to about $1.25 per move.
Against Conveyor B, the AMR is cheaper up to 48,000 moves a year, or 12 an hour, and dearer above that, because two robots at $60,000 exceed the conveyor's $42,000. Against Conveyor A, the AMR never wins on a fixed route, because one robot at $30,000 already exceeds $9,375.
The assumed five minutes is deliberately far from a spec-sheet cycle. A 250-ft route is a 500-ft round trip, or 152 m. At the MiR250's published top speed of 7.2 kph (2.0 m/s, 250 kg payload), that takes about 76 seconds. Rated speed therefore accounts for about 1.3 minutes of the cycle. The rest covers slower real speed, docking, waiting, loading, unloading and charging. Use measured cycle time, not rated speed.
For a reality check on the robot line, the OTTO/PULSE study costed a unit running 24 x 7 x 52 at $40-50k per vehicle per year. That is vendor-published and dated, and well above our $30,000, so test a higher figure. AMD gives individual AMRs at $30,000-$150,000 and deployed fleets at about $200,000-$800,000.
Three sensitivities that flip the answer
Route life
Conveyor B looks very different if the route ends early, while the model's robot cost stays the same.
| Case against Conveyor B | Annual conveyor cost | Break-even, moves a year | Break-even, moves an hour |
|---|---|---|---|
| Base case: 10-year route, 5-minute cycle | $42,000 | 48,000 | 12 |
| 5-year route | $70,000 | 96,000 | 24 |
| 3-year route, before removal cost | $107,333 | 144,000 | 36 |
| 10-year route, 10-minute real AMR cycle | $42,000 | 24,000 | 6 |
Route life does not rescue the AMR against a cheap run, though. Even at three years, Conveyor A costs $23,958 a year, still below one robot.
The clearest published story on route life comes from a warehouse, so apply it with care. Modern Materials Handling reported that Waytek, a Minnesota electrical-components distributor, ran a conveyor sorting up to 800 orders a day for 13 years before replacing it. Expansion would have meant a major redesign that interrupted operations, so Waytek chose AMRs. Three Fetch CartConnect100 robots and 32 carts were reported as capable of up to 25% more orders a day, and removing the conveyor reclaimed 13% of floor space. MMH reported no cost figures. The lesson runs both ways: a fixed route gave 13 years of service, and then a layout change ended it.
Real cycle time
Doubling the AMR cycle to 10 minutes halves moves per robot-year to 24,000, so the break-even against Conveyor B drops from 12 moves an hour to 6. Congestion, docking delays and a poor charging schedule all land here. A vendor's cycle estimate for an empty aisle is an optimistic input.
Installed conveyor price
Published per-foot pricing is too wide to plan on. Bay Street gives powered belt or roller at $60-$250 per foot installed, gravity roller from $30 per foot and sortation at $800-$1,500 per foot. Tavoron, an integrator, says most experts budget about $1,500 per linear foot, though its cost drivers, such as truss framing and slide gates, read to us like bulk-belt systems and not unit handling. AMD puts transfer conveyors at $150,000-$500,000.
By our arithmetic, a 250-ft run costs $15,000 at $60 per foot, $62,500 at $250 and $375,000 at $1,500. That 25-fold spread alone can flip the result, so your own quote matters more than any published average.
The robot price deserves a current quote too. Interact Analysis said in 2024 that average selling prices "have dropped considerably," but that discussion concerned shelf-to-person warehouse robots and low-cost suppliers, so it is no price series for plant-grade AMRs.
Costs that sit outside cost per move
Downtime. Cisco-Eagle grants that "a particular AMR can be offline without shutting down the operation, where a broken conveyor can shut down flow for at least the line it services." That advantage needs a fleet: where one robot serves the route, as in the example at up to 48,000 moves, that robot is its own single point of failure. Price the difference with our downtime cost calculator, which separates lost contribution from incremental recovery costs.
Floor space. Waytek's 13% is one warehouse's result. If your freed space has a use, assign it a value. If it does not, leave it at zero.
Vendor continuity. This is a newer line in the AMR column. Zebra paid $290 million for Fetch in 2021, then said in a Dec. 9, 2025 SEC filing that it would dispose of or exit the business. The Robot Report said most robotics staff would go by the end of 2025, with about 25% staying to March 2026 to manage current deployments, and that the future of robots at customer sites "now likely appears tied to whether Zebra can sell the group to a new owner."
Zebra's 10-Q for the quarter ended April 4, 2026 says it "completed the sale of its robotics automation business to Skild AI" on March 27, 2026, for total consideration of $20 million: $9 million in cash, a $9 million investment and $2 million in escrow. Waytek's AMRs were Fetch robots. A robot's software, fleet manager and spares depend on its owner in a way a run of powered roller generally does not, so a five-year robot life is an assumption about the supplier as well as the hardware.
Labor and tax. The model leaves out labor because both options automate the move. Add it only where one option needs less handling at the ends of the route. BLS 2025 wage data via O*NET gives national medians of $46,420 a year for industrial truck and tractor operators and $40,240 for hand laborers and material movers, before burden. On tax, the IRS says the OBBB provides a permanent 100% additional first-year depreciation deduction for qualified property acquired after Jan. 19, 2025. Lease or service structures may be treated differently from owned assets, so run the after-tax case with your tax adviser once the pre-tax ranking is clear.
Other fixed-path options. A conveyor may not be the only fixed comparison. On a 20-station line with carts up to 4,000 lb, Jeff Chu of integrator Eckhart found three AGVs could replace 20 at a price comparable to a tow line, and that "it was not necessarily true that tow lines are vastly more cost efficient than AGVs." That finding concerns AGVs and tow lines, but it shows why fleet size, more than unit price, can decide these comparisons.
The decision rule
-
Choose the conveyor when the route is fixed for the life of the asset and volume is high and steady.
-
Choose the AMR when volume per route sits below the first robot-capacity steps, or the route will change before the conveyor pays out.
-
Do not settle it on the blended figure. Run both options against your own load profile, including peak hours, and normalize to cost per unit moved.
Market growth should not sway the call. The IFR's World Robotics 2026 release says transportation and logistics service robots reached 117,500 units in 2025, up 21%, but that is sample data from 238 suppliers on a category broader than plant AMRs.
Before signing, ask the AMR seller for measured cycle-time data at a layout like yours, the assumptions behind fleet size, software terms and end-of-support commitments, and what happens to software and spares if the business changes hands. Ask the conveyor seller for an installed price that includes controls and electrical, the expected maintenance labor, and the cost to remove or reroute the line. Ask both for the load profile behind any payback figure. If a seller cannot supply one, leave the claim out of your model.
Related reading
-
Will PJM's Backstop Bill Reach Factories Without Data Centers?
-
Auto Parts Makers Nearly Doubled Robot Orders as Food Plants Pulled Back
Sources
-
Cisco-Eagle: Comparison: Conveyor Systems and Autonomous Mobile Robotics (Sept. 12, 2023)
-
Cisco-Eagle: AGVs, AMRs, and Conveyors: Automated Product Transport Applications (Jan. 5, 2023)
-
Hytrol: Hytrol and Cisco-Eagle Celebrate 50 Years (Nov. 29, 2022)
-
Hytrol: Everything You Need to Know About Total Cost of Ownership (Nov. 16, 2021)
-
OTTO: The Business Case for Autonomous Mobile Robots in Manufacturing (Jan. 18, 2021)
-
OTTO: Seeing Is Believing: Simulating AMRs for Successful Deployments (May 19, 2022)
-
AMD Machines: Material Handling Automation ROI (March 22, 2026)
-
Bay Street Lending: Conveyor System Financing (updated Sept. 2026)
-
Tavoron: How Much Does It Cost to Install a Conveyor System?
-
Modern Materials Handling: Gaining Throughput and Space with Mobile Robots (Nov. 8, 2022)
-
Modern Materials Handling: MiR launches faster, shorter and narrower MiR250 (March 11, 2020)
-
Zebra Technologies: Form 10-Q for the quarter ended April 4, 2026
-
The Robot Report: Zebra Technologies winding down Fetch-based mobile robot group (Dec. 12, 2025)
-
Advanced Manufacturing: Zebra to Phase Out Autonomous Mobile Robot Division (Dec. 18, 2025)
-
AdvancedManufacturing.org: The Robot Didn't Fail, the Factory Did (July 15, 2026)
-
SME: AGVs & AMRs as Alternatives to Tow Line Conveyance (Feb. 9, 2022)
-
O*NET OnLine: National Wages, Industrial Truck and Tractor Operators, 53-7051.00
-
O*NET OnLine: National Wages, Laborers and Freight, Stock, and Material Movers, Hand, 53-7062.00
-
IRS: News release on 100% additional first-year depreciation (IR-2026-06)
-
IFR via Kyodo News PR Wire: Global Sales of Professional Service Robots Surge 24% (Sept. 30, 2026)
This article contains AI-assisted content and has been reviewed in our editorial workflow.