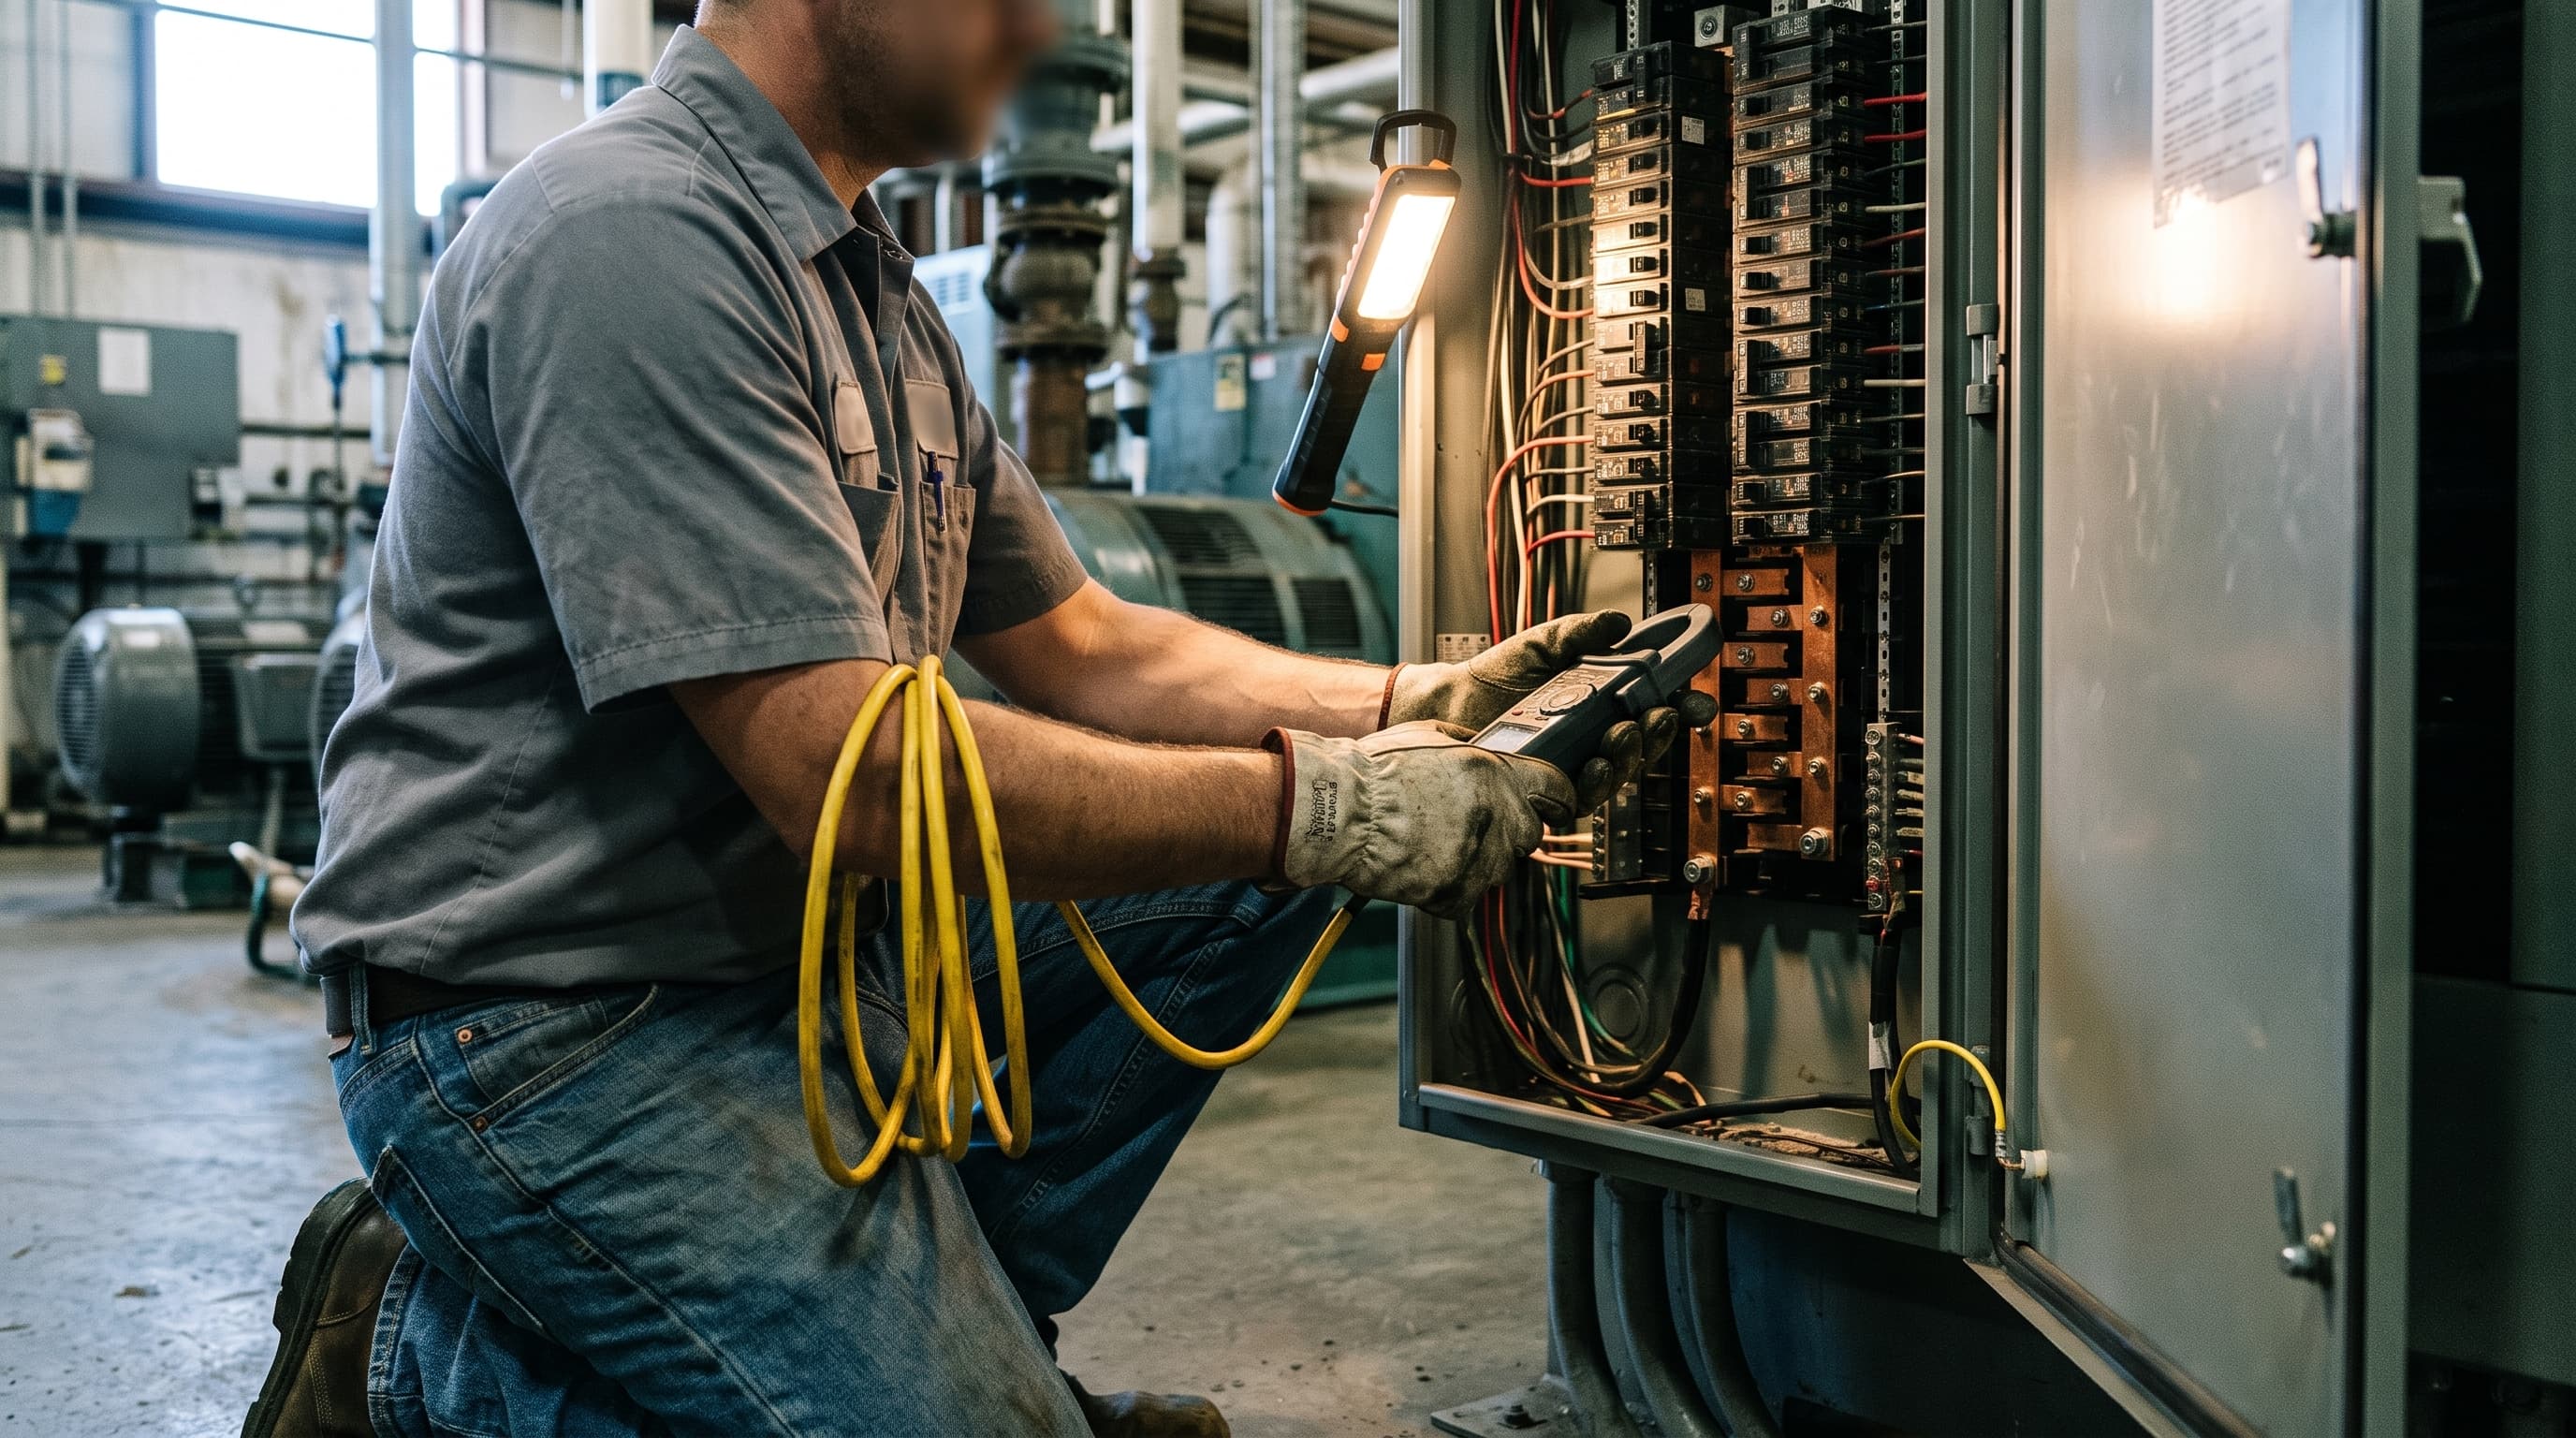
Industrial energy audit cost savings average $144,345 per plant per year, according to the Department of Energy's Industrial Training and Assessment Centers, which have completed more than 23,000 no-cost assessments. Plants with annual energy bills between $100,000 and $3.5 million qualify, and implementation grants cover half of project cost up to $300,000.
That number is the reason to slow down on the power purchase agreement sitting in your inbox. A PPA is a multi-year price commitment written against a load curve. If nobody in your plant can produce twelve months of interval data, you are not negotiating a price. You are guessing at a quantity and letting a developer price the uncertainty.
The contract market is expensive right now, and waiting a quarter is cheap
The LevelTen North American PPA Price Index for Q2 2026 shows wind PPA prices up 5.5% quarter over quarter and 17.5% year over year. LevelTen attributes the run to tariffs, gas-linked turbine delivery costs, and federal permitting delays including a Department of Defense halt on security mitigation agreements. Solar fell 4.8% quarter over quarter, its first decline in two years, which LevelTen ties to soft corporate buy-side demand rather than to any easing on the supply side.
That single quarter sits on top of a steep arc. In Q1 2026, solar P25 pricing was up 4.6% quarter over quarter and more than 13% year over year, with wind up nearly 8% and almost 24% respectively. The cited drivers were tariffs, rising insurance costs, labor shortages, permitting bottlenecks, and new turbine height requirements. None of those resolve on a ninety-day clock.
Compare that to what you actually pay today. EIA's Electricity Monthly Update puts the US industrial sector average retail price at 9.17 cents per kWh in June 2026, up 3.0% from June 2025. The all-sector average was 14.48 cents, up 4.5%. Industrial buyers are absorbing a milder increase than commercial (4.8%) or residential (5.0%) customers. The utility bill is going up, but slowly, and the contract market is going up faster. The option value of waiting one or two quarters while you fix your own load is real.
Step 0: read the bill and find out what you are actually buying
Split the invoice into energy charges (cents per kWh consumed) and demand charges (dollars per kW of peak). Demand charges commonly account for 30% to 70% of a commercial and industrial monthly electric bill, and they are set by the single highest 15-minute interval in the billing period multiplied by the $/kW rate.
This is the whole argument in one line: a PPA prices energy. It does almost nothing for the demand line. If half your bill is a ratchet driven by one bad quarter-hour a month, and you sign a ten-year energy contract to fix it, you have hedged the smaller half of the problem and left the larger half untouched. Find the interval that set your peak. If it turns out to be three compressors, a chiller, and an oven all restarting after a shift change, that is a scheduling fix, not a procurement fix.
Step 1: submeter before you shop
Instrument in this order: the motor-driven systems, the compressed air header, and the single largest process heat load. Motor-driven systems (pumps, fans, compressors, and materials handling) account for roughly 68% to 70% of electricity use in US manufacturing plants, which is why they dominate every payback table anyone has ever shown you.
Get interval data at the panel, not at the utility meter. Utility-grade data tells you when the plant peaked. Panel-level current transformers and loggers tell you which asset did it. A few thousand dollars of CTs and data loggers is the entry fee against an average identified savings figure of $144,345 a year, and it is also the input that makes every later step, including the contract, defensible in front of a CFO.
Step 2: take the free assessment
The DOE Industrial Training and Assessment Centers program provides assessments at no cost to the manufacturer. Eligibility is straightforward: annual energy bills between $100,000 and $3,500,000, annual revenue under $250 million, and a location within 150 miles of a participating center.
Per DOE's program page, the process runs as a remote pre-survey, a one to two day site visit, and a confidential report delivered within 60 days. DOE cites an average of $141,400 or more in savings identified per facility across 21,650 or more manufacturers and 161,200 or more recommendations. ITAC Implementation Grants then cover up to 50% of project cost, capped at $300,000 per qualified recommendation, for manufacturers assessed since 2018. Applications run on a rolling basis with quarterly reviews, submitted through energywerx.org.
For budgeting context, here is what you would otherwise pay:
| Audit level | Typical cost | What it produces |
|---|---|---|
| ASHRAE Level 1 walkthrough | $0.05 to $0.15 per sq ft | Screening, obvious no-cost and low-cost measures |
| ASHRAE Level 2 | $0.15 to $0.30 per sq ft | Measure-level savings and cost estimates |
| ASHRAE Level 3 (investment grade) | $0.30 to $0.50+ per sq ft | Financeable analysis for major capex |
| Complex industrial facility | $25,000 to $100,000+ | One to three months elapsed |
If you qualify for ITAC, the free assessment displaces most of a paid Level 1 or Level 2 engagement. If you do not qualify, run ENERGY STAR's treasure hunt yourself first. It is a one to three day cross-functional walkthrough aimed at operations and maintenance fixes, and ENERGY STAR reports that hundreds of organizations have used it to cut facility energy use by up to 15%. The 31-page industrial how-to guide, the printable checklists, and the Excel quantification sheets are free.
How much waste is actually in there, stated honestly
You will see the claim that US manufacturing wastes two thirds of the energy it consumes. It comes from DOE's Manufacturing Energy and Carbon Footprints, built on the 2018 MECS data, which puts primary energy entering US manufacturing at 19,663 TBtu, of which roughly 39% ends up as applied energy.
Read the loss buckets before you put that number in a capital request. The largest single bucket, about 4,721 TBtu, is electricity and steam generation and transmission losses. Those occur at the power plant and on the wires. No plant manager captures them inside the fence. The remainder is where your projects live: roughly 4,432 TBtu of nonprocess losses, 1,292 TBtu of process losses, and 853 TBtu of steam distribution losses.
So the honest framing is not "two thirds of your bill is recoverable." It is that the in-fence addressable share, the nonprocess, process, and steam distribution losses, is still very large, and it is the part a submeter and a wrench can reach.
Step 3: fix the waste in payback order
Compressed air first. DOE's widely cited estimate is that leaks drain 20% to 30% of compressor output in a typical plant. Well-run plants hold under 10%. The Compressed Air Challenge fact sheet gives annual cost per leak by orifice size: roughly $523 for a 1/16 inch leak, $2,095 for 1/8 inch, and $8,382 for 1/4 inch.
Note the basis before you quote those numbers to your team. The underlying table assumes electricity at roughly 5 cents per kWh. At the current 9.17 cent industrial average, the same leaks cost close to double. Scaling the fact sheet figures by that rate ratio gives roughly $960, $3,840, and $15,400 respectively. Use your own contract rate rather than either figure, but do not present the 5 cent table as current money.
Then variable frequency drives on throttled pumps and fans. Any system where flow is controlled by a valve or damper against a constant-speed motor is a candidate, and this is where the 68% to 70% motor-system share turns into a payback table.
Then steam distribution and heat recovery. The 853 TBtu of steam distribution losses in the DOE footprint are traps, insulation, and condensate return. These are maintenance line items with capital-project returns.
Step 4: make the savings stick
A treasure hunt produces a one-time cut. Without a management system, the plant drifts back. Energy management systems in the ISO 50001 mold are associated with roughly 4% annual energy savings sustained year over year for more than a decade. DOE's 50001 Ready program provides the toolset free, on a self-attestation basis, with no third-party audit required.
This is the difference between a one-time 12% cut and a compounding one, and it is also the difference between a load curve you measured once and a load curve you can forecast. The second one is what you want in hand at the negotiating table.
Step 5: monetize flexibility before you buy generation
Capacity prices have made curtailable load a revenue line rather than a rounding error. PJM's 2026/2027 Base Residual Auction, announced July 22, 2025, cleared at the FERC-approved cap of $329.17 per MW-day across the entire footprint, procuring 134,311 MW of capacity and demand response. At 365 days that is roughly $120,000 per MW-year.
Before you get excited: that price is paid for a commitment, and the commitment has teeth. The question for your operation is which loads you can genuinely shed on notice without scrapping product or blowing a customer ship date. Ovens with thermal mass, chillers, battery charging, and non-bottleneck compressors are usually the honest answers. The bottleneck cell is not. Price the production disruption before you price the revenue.
Step 6: now price the contract, against the smaller load
Specialized Packaging Group cut electricity costs by more than 25% at its Chihuahua, Mexico plant using combined solar generation and battery storage under an energy-as-a-service model, paying only for energy consumed with no upfront infrastructure investment, with reported avoided emissions of 461 tons of CO2 per year, as Packaging Dive reported. System size and vendor were not disclosed.
Two caveats that matter more than the headline number. First, energy-as-a-service is itself a multi-year energy contract. It is a contract with the capex moved onto someone else's balance sheet, not an escape from contracting. Second, that plant buys power on Mexican CFE tariffs, not a US utility rate, so the percentage does not transfer to a plant in Ohio.
What does transfer is the sequence. Sign the contract after the waste work, not instead of it, and size it to the load you actually have. In the same Packaging Dive piece, Smurfit Westrock went the other direction at scale, signing a ten-year virtual PPA for wind in Spain. Both are contracts. The difference is whether you know your own demand curve when you sign one.
The capex fork, and a clock that is already running
Three structures, three different balance sheet stories. Owned solar puts the asset and the tax attributes on your books. Energy-as-a-service moves the capex off, at the cost of a long-term purchase obligation. A virtual PPA is a financial hedge that never touches your meter.
If ownership is still on the table, note the deadline. Under the One Big Beautiful Bill Act, the Section 48E clean electricity investment credit terminates for solar placed in service after December 31, 2027. The begin-construction safe harbor date of July 4, 2026 has already passed. A project starting now is working against the placed-in-service cliff, not the safe harbor, which compresses engineering, procurement, and interconnection into a window that interconnection queues alone can eat. IRS Notice 2025-42 governs the beginning-of-construction tests, and any plant relying on this credit should have tax counsel read the notice rather than a trade press summary.
The decision rule to hand your CFO
Do not sign a multi-year energy contract until the plant can produce three artifacts: twelve months of interval data, a demand profile that identifies which assets set the monthly peak, and a completed list of no-cost and low-cost measures with the implemented ones marked off.
A plant that walks in with those three documents buys less energy, buys it against a flatter curve, and can credibly sign for five years instead of ten. That is a cheaper contract on every axis, and none of it requires a view on where PPA prices go next.
Sources
-
Industrial Training and Assessment Centers, US Department of Energy
-
Manufacturing Energy and Carbon Footprints (2018 MECS), US Department of Energy
-
2018 MECS All Manufacturing Energy and Carbon Footprint (DOE, prepared by Energetics)
-
PJM Auction Procures 134,311 MW of Generation Resources, PJM Inside Lines
-
Packaging companies look to renewables, energy efficiency to reduce costs, Packaging Dive
-
IRS Notice 2025-42: Beginning of Construction for Sections 45Y and 48E
-
EIA Electricity Monthly Update, June 2026 retail price data
-
Compressed Air Challenge, cost of compressed air leaks fact sheet