
The ISM manufacturing PMI for October 2026, released Nov. 2, came in at 55.5, up from 54.5 in September. Inside that number, the Production Index rose 2.3 points to 59.0. ISM called it "the index's highest reading since it registered 60.5 percent in November 2021." The Employment Index went the other way, easing 0.3 point to 52.4. That leaves a 6.6-point gap between the two. Factories are producing more, and they are adding people more slowly than they are adding output.
This isn't a layoff story. Plants are getting more out of the crews and hours they already have, and robot orders have picked up. For a plant manager, the question is what to do on the floor when output runs ahead of headcount: when to authorize overtime, how to read unit labor cost, and when a cobot cell beats another requisition.
What the October ISM report showed
According to ISM, the manufacturing PMI has now expanded for 10 months, and the overall economy has expanded for 24 straight months. The key October readings, with September in parentheses:
-
PMI: 55.5 (54.5)
-
Production: 59.0 (56.7), expanding for a 12th month
-
New Orders: 55.5 (55.3)
-
Employment: 52.4 (52.7), expanding at a slower pace for a 4th month
-
Backlog of Orders: 54.6 (56.4)
-
Supplier Deliveries: 59.1 (59.0)
-
Inventories: 51.4 (48.6), back in expansion
-
Customers' Inventories: 41.6, which ISM rates as "too low"
-
Prices: 75.2 (77.9), still increasing for a 25th month
-
New Export Orders: 51.2; Imports: 52.9
How to read the employment gauge
ISM indexes are diffusion indexes. They measure how many purchasing managers report an increase versus a decrease, not how large the change is. A production reading of 59.0 means increases are widespread. It does not mean output rose 9%.
The same logic applies to employment. ISM's own benchmark says "an Employment Index above 50.3 percent, over time, is generally consistent with an increase in the Bureau of Labor Statistics (BLS) data on manufacturing employment." At 52.4, the index points to modest job growth, not cuts. Susan Spence, chair of ISM's Manufacturing Business Survey Committee, said "the panelist comment ratio of hiring to managing/reducing head counts was 1.8-to-1."
So the October picture is broad production growth with narrower hiring. Spence's summary: "The Employment Index remained in expansion but lost 0.3 percentage point."
Which industries are hiring, and which are not
ISM reported employment growth in 8 of 18 industries and declines in 5:
-
Employment growing: Plastics & Rubber; Wood Products; Machinery; Electrical Equipment, Appliances & Components; Primary Metals; Transportation Equipment; Computer & Electronic Products; Food, Beverage & Tobacco.
-
Employment declining: Printing; Nonmetallic Mineral Products; Paper Products; Miscellaneous Manufacturing; Chemical Products.
ISM also said four of the six largest industries reported higher employment.
Production grew in 11 industries. ISM listed the five leaders in this order: Primary Metals, Computer & Electronic Products, Plastics & Rubber Products, Textile Mills and Transportation Equipment. Four of those five also reported employment growth. In those industries, rising output is pulling in at least some new hiring. Textile Mills led on production but was not among the eight industries that reported employment growth.
The practical point: whether output is outrunning hiring at your plant depends heavily on the industry. A primary metals or electronics plant competing for the same labor pool as growing neighbors faces a different hiring market than a chemicals or paper plant whose sector is reducing headcount.
What the BLS hard data says
Survey data and payroll data agree on the direction. The BLS September 2026 Employment Situation (released Oct. 2) said: "Manufacturing employment was little changed in September (+9,000) but is up by 72,000 since a recent low in December 2025." Plastics and rubber and machinery each added about 5,000 jobs.
Hours didn't move. "In manufacturing, the average workweek was unchanged at 40.6 hours, and overtime held at 3.0 hours," BLS reported. Those figures cover all employees.
For a longer view of overtime, BLS's Economics Daily (Mar. 31, 2026) tracks a different series: production and nonsupervisory employees, not seasonally adjusted. On that basis, manufacturing weekly overtime averaged 3.8 hours in 2025, up from 3.6 in both 2023 and 2024. The peak was 4.6 hours in 2018. By industry, transportation equipment averaged 5.3 hours and machinery 2.5. Because the worker group and seasonal adjustment differ, the 3.8-hour annual average can't be compared directly with September's 3.0-hour all-employee figure. Use each series to benchmark against its own history.
Unit labor cost: the number that shows up in margins
The latest complete labor-cost data is the BLS Productivity and Costs release for Q2 2026, revised (Sept. 3). Manufacturing output rose 5.4% while hours rose 2.9%, so productivity rose 2.4%. BLS said the output gain "is the largest since the second quarter of 2021."
Unit labor cost is hourly compensation divided by output per hour. If pay per hour rises more slowly than output per hour, the labor cost of each unit falls. That is what happened in Q2. Hourly compensation rose 2.1% and productivity rose 2.4%, so manufacturing unit labor costs fell 0.3%. BLS: "This is the first decline in unit labor costs for the manufacturing sector since the second quarter of 2021."
That one quarter doesn't reverse the trend. Unit labor costs were still up 3.4% from a year earlier, while productivity was up only 1.1%. Over a full year, compensation has risen faster than output per hour.
The revision also matters. The preliminary Q2 release showed manufacturing productivity up 1.9% and unit labor costs unchanged. The revision raised productivity to 2.4% and cut unit labor costs to minus 0.3%. Preliminary productivity figures can move by half a point, so don't base a staffing decision on a single first print.
Durable and nondurable goods diverged sharply:
-
Durable manufacturing: output +8.9%, hours +5.1%, productivity +3.6%. These plants added hours, but output grew faster.
-
Nondurable manufacturing: output +1.4%, hours -0.6%, productivity +2.1%. These plants produced more with fewer hours.
Input prices are still rising
Labor isn't the only cost pressure. ISM's Prices Index eased to 75.2 but has signaled rising prices for 25 straight months. ISM says a reading above 52.8 is generally consistent with a rising BLS producer price index for intermediate materials. Among negative panelist comments, Spence said, pricing volatility came up in 62%, tariffs in 25% and the Iran war in 21%.
With material costs still rising, the per-unit labor gains a plant can control are worth more. A plant that holds labor cost per unit flat has more room to absorb a material increase it can't control.
Overtime, a hire or automation: how to choose
The October readings give a mixed demand signal. New orders held at 55.5, but backlog fell from 56.4 to 54.6. Customers' inventories are "too low," which suggests restocking demand, and the Inventories Index moved back into expansion. Read together, demand looks solid, but backlog isn't building fast enough to guarantee every new position stays busy. Match the tool to the type of demand.
Use overtime for short spikes
Overtime makes sense when the demand increase is likely to last weeks, not quarters, and when the bottleneck is staffed by people who already know the work. It carries no training cost and is easy to reverse. The risk is fatigue, quality escapes and turnover if overtime becomes the default.
Hire for sustained backlog
A hire makes sense when backlog has held up for several months and the work needs judgment, setup skill or flexibility across stations. The October drop in backlog is a reason to check your own order book before opening requisitions. Don't assume the national new-orders number reflects your customers.
Automate repetitive bottlenecks
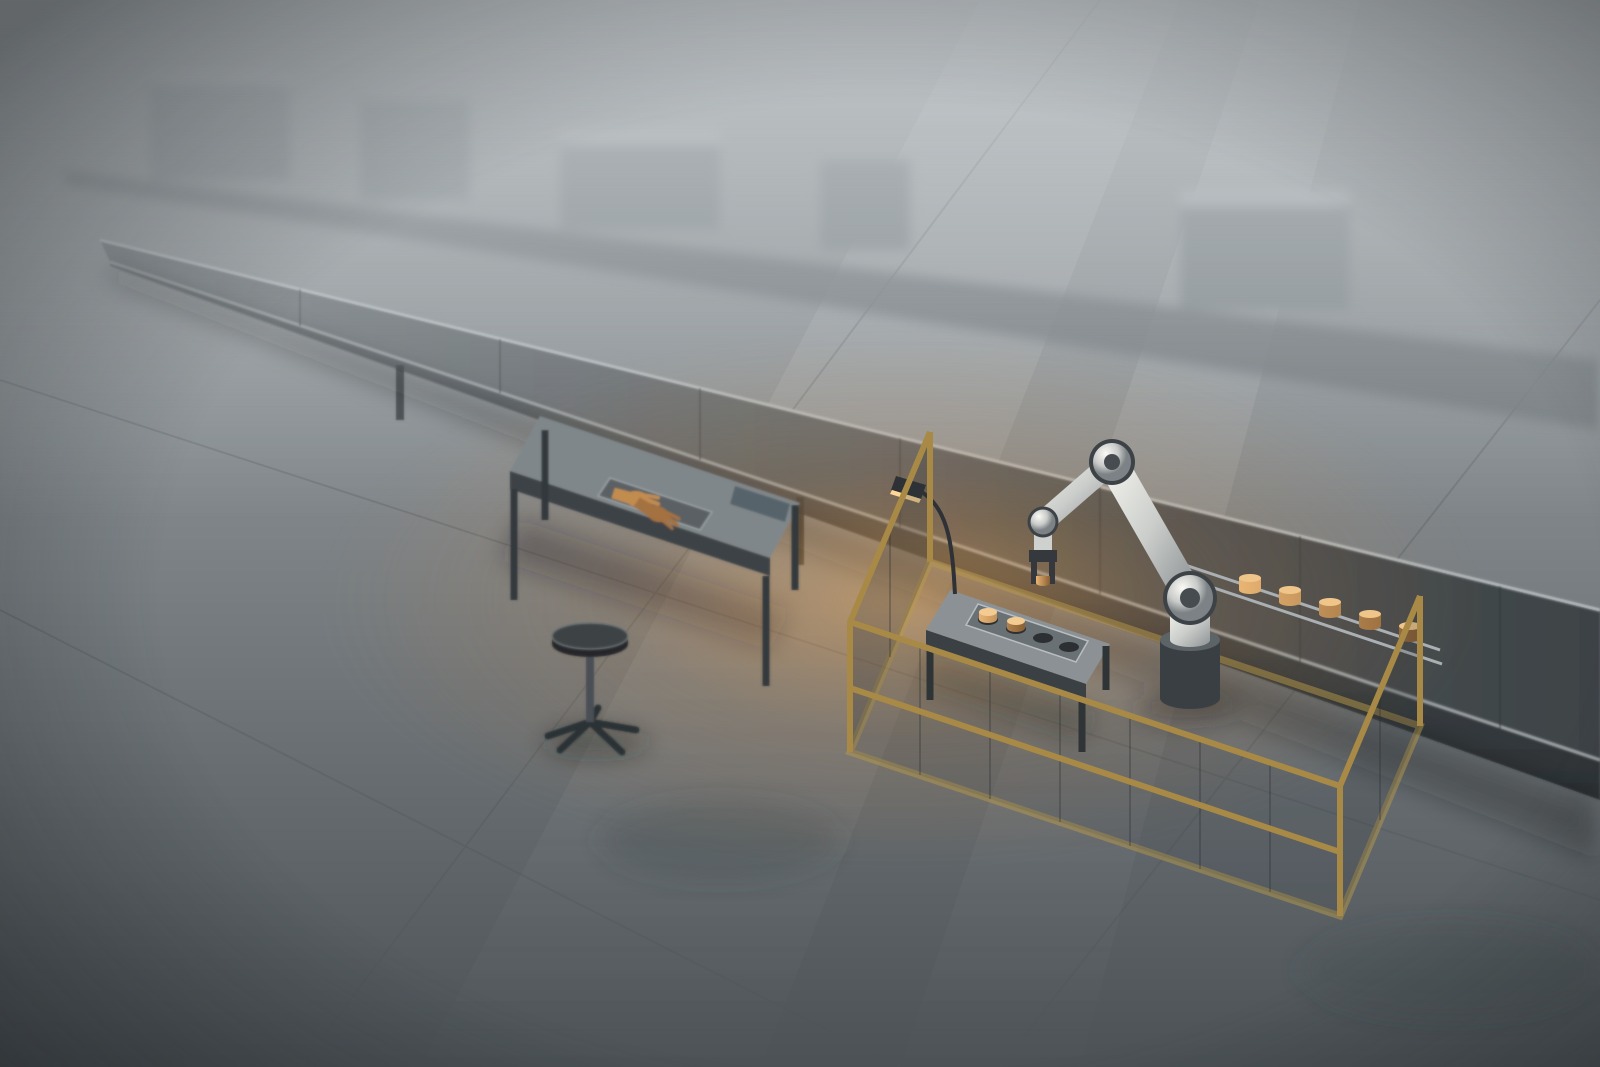
Automation makes sense for repetitive tasks at a constrained station, such as machine tending, palletizing, inspection or packaging, especially where the same task runs across shifts. Plants are buying. A3 data reported by The Robot Report show North American companies ordered 10,989 robots worth $723.5 million in Q3 2026, up 24.8% in units and 26.1% in value from a year earlier. Through nine months, orders totaled 28,984 robots worth about $1.89 billion (+9.6% in units, +13.3% in value).
Cobots grew fastest: 1,831 units worth $63.8 million in Q3, up about 56% in units and 16.7% of all units ordered. Year to date, buyers ordered 4,605 cobots worth about $178 million.
By industry, Q3 unit orders changed as follows, according to A3:
-
Semiconductors, electronics and photonics: +97.6%
-
Automotive components: +90.4%
-
Plastics and rubber: +67.7%
-
Life sciences, pharma and biomed: +38.7%
-
Metals: +37.0%
-
Automotive OEM: +7.5%, still 17% below the prior year through nine months
-
Food and consumer goods: -23.7%
Several sectors appear on both lists. Plastics and rubber, computer and electronic products, and primary metals led ISM's production growth, and their counterparts in A3's data are buying more robots. "What stands out in the third quarter is not simply the magnitude of the growth, but how broadly it was distributed across the market," said A3 EVP Alex Shikany.
Floor checklist
-
Set overtime triggers before you need them. Define a threshold, such as average overtime per worker at a given cell held for a set number of consecutive weeks, that automatically triggers a hire-or-automate review. Benchmark it against your own history, not against a mismatched national series.
-
Baseline productivity before adding a shift. Record output per labor hour at the bottleneck for several weeks. If a new shift or hire doesn't increase output per hour, you're adding cost without adding capacity.
-
Calculate your own unit labor cost. Divide total loaded labor cost by good units shipped each month. Compare the rate of change in hourly cost with the rate of change in output per hour, as BLS does. If compensation grows faster than output per hour, unit labor cost is rising.
-
Run cobot payback against the right alternative. Compare the installed cell cost (hardware, tooling, integration, programming and guarding) with the annual cost of the overtime or headcount it replaces, plus the contribution from any output the bottleneck currently loses. Payback in years equals installed cost divided by annual net savings plus recovered contribution.
-
Price recovered output separately from cost savings. Use the ManufacturingMag downtime cost calculator to separate lost contribution from incremental recovery costs such as expedited freight and overtime. Output a cell recovers at a constrained station is often worth more than the labor it saves.
-
Don't base decisions on a first print. Q2 productivity was revised up by half a point. Wait for a second data point before committing to a staffing change.
What to watch this week
BLS will publish two releases that test this picture. Preliminary Q3 2026 Productivity and Costs is due Thursday, Nov. 5, and the October 2026 Employment Situation is due Friday, Nov. 6, both at 8:30 a.m. ET. Together they will show whether output per hour kept rising after Q2 and whether factory payrolls are keeping up with ISM's production reading.
Related reading
-
How to Find the Cost-per-Move Break-Even for AMR vs Conveyor
-
Will PJM's Backstop Bill Reach Factories Without Data Centers?
-
When Should a Mid-Size Plant Register Its Own Apprenticeship Program?
-
The Hardest Manufacturing Jobs to Fill This Fall Are Hybrid Roles
-
Amazon Plans to Hire Welders for Its Greenwood, Indiana Plant
Sources
-
Manufacturing PMI at 55.5%; October 2026 ISM Manufacturing PMI Report (PR Newswire)
-
Productivity and Costs, Second Quarter 2026, Preliminary (BLS archive)
-
Overtime hours in manufacturing industries (BLS The Economics Daily, Mar. 31, 2026)
-
North American robot orders climb 24.8% in Q3 of 2026, says A3 (The Robot Report)