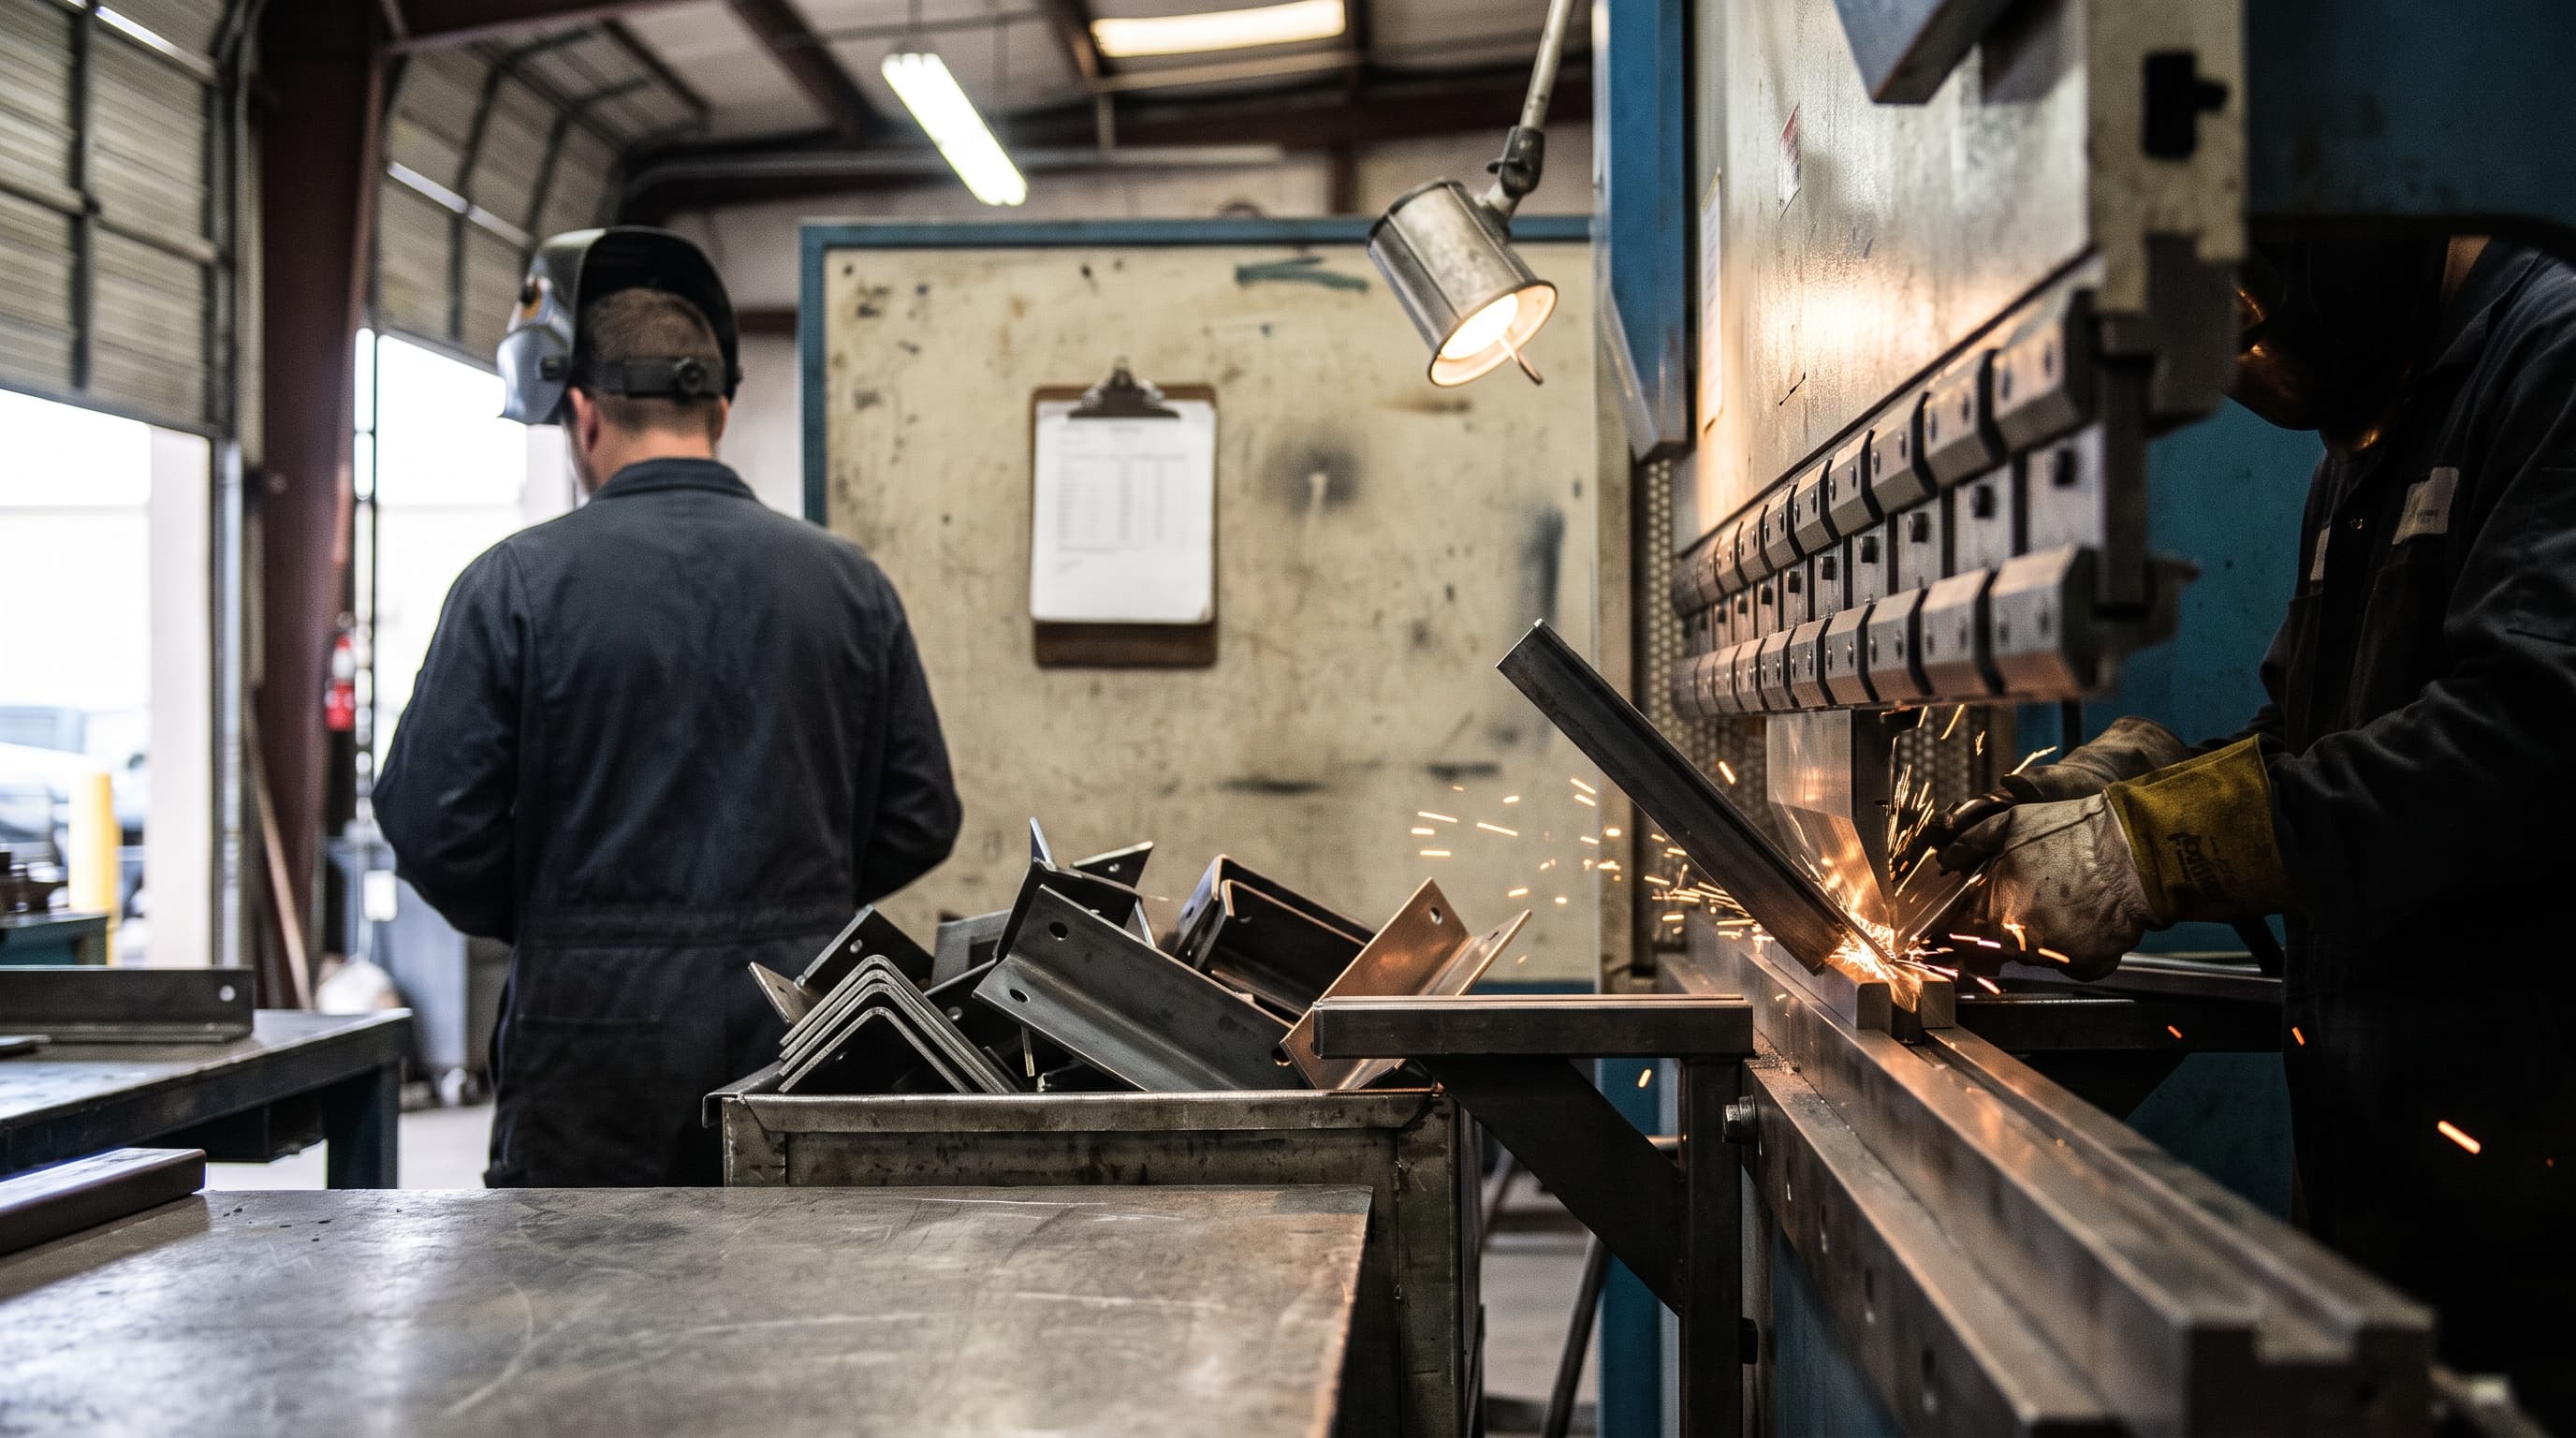
The manufacturing jobs report August 2026, released Friday, Sept. 4, shows factory payrolls up 16,000 to 12,638,000, with machinery (up 6,100) and fabricated metal products (up 5,700) supplying about three quarters of the gain. Durable goods added 15,000 while nondurables were flat at 1,000. Total nonfarm rose 162,000. Manufacturing now sits roughly 23,000 above August 2025.
That last sentence is the one to sit with. A 16,000 gain reads well in a headline and reads very differently on a twelve month chart. What follows is the composition, the wage benchmarks you should actually be repricing against, and the four or five caveats a careful operator applies before changing a requisition plan.
Who did the hiring
Machinery manufacturing (NAICS 333) added 6,100 jobs to a level of 1,097,300. Fabricated metal product manufacturing (NAICS 332) added 5,700 to 1,460,800. The BLS release text rounds both to +6,000, which flattens the detail, but the unrounded figures in Table B-1 are the ones worth reading: together those two subsectors are about 74% of the entire 16,000 manufacturing gain.
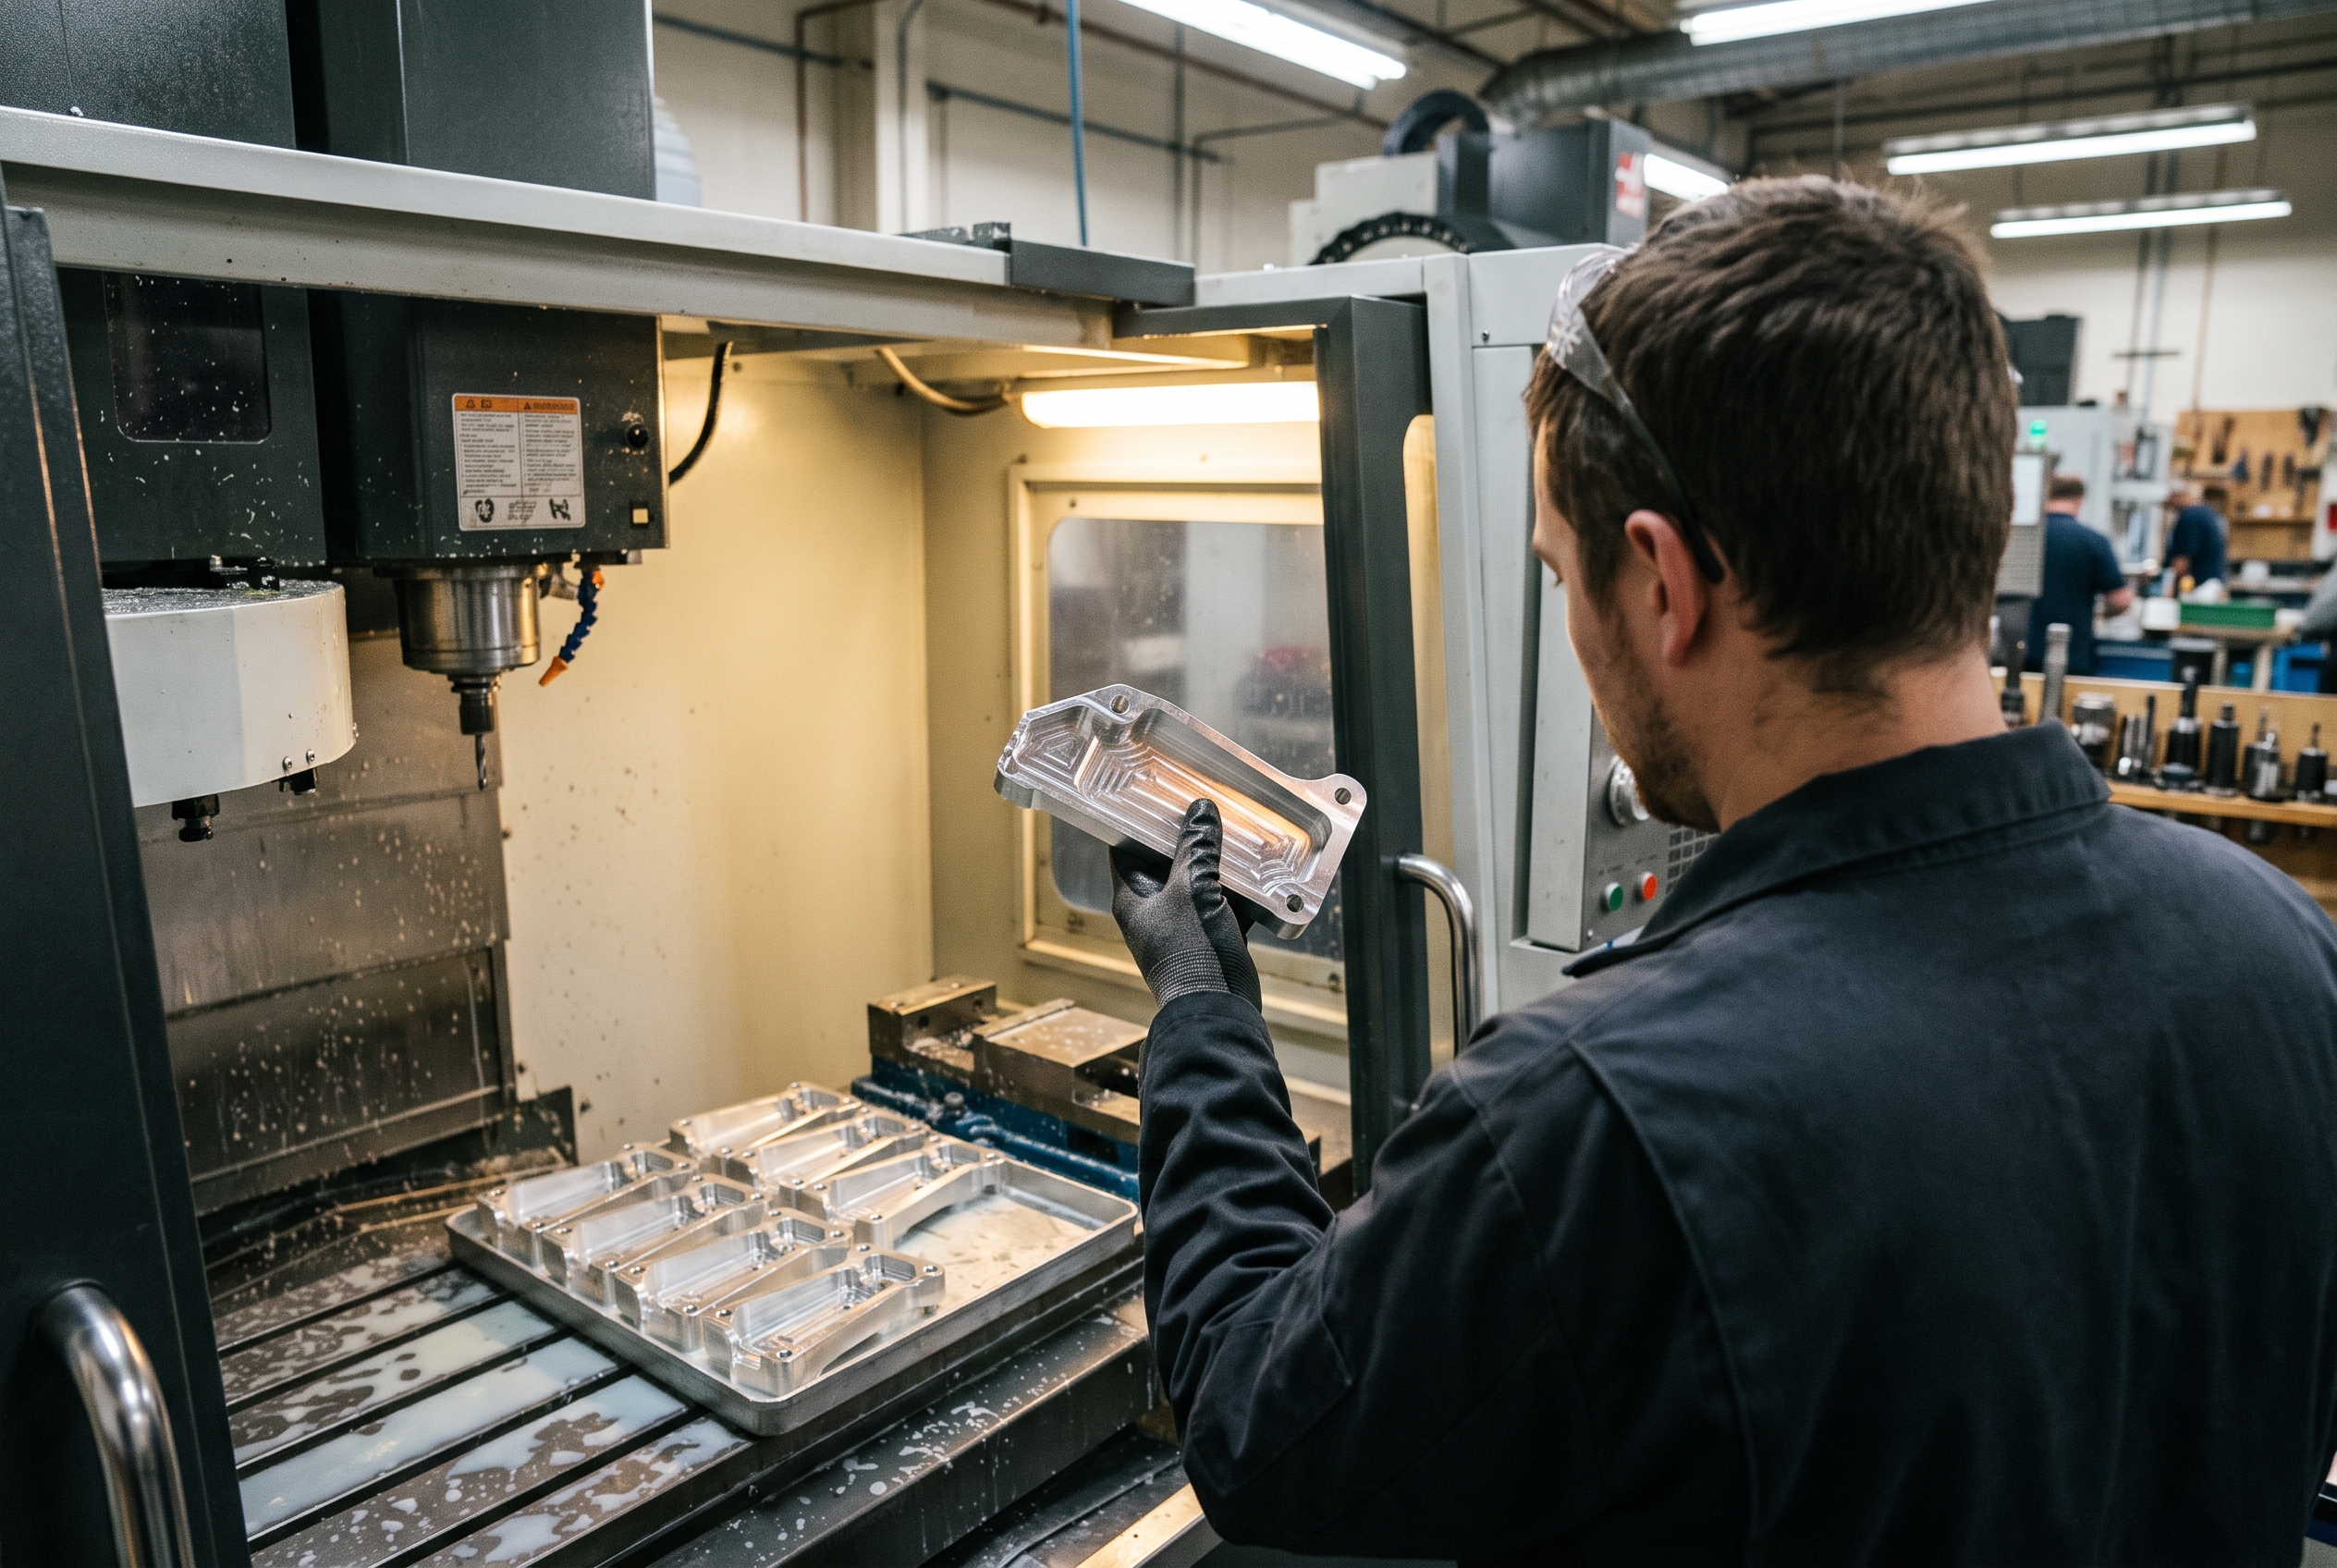
Those are the shops that build and bend things for other manufacturers. Machinery was also among the 15 industries reporting growth in ISM's August survey. The demand-side backdrop is consistent: Census reported new durable goods orders up $3.6 billion, or 1.1%, to $339.3 billion in July, with transportation equipment up 2.3% to $116.2 billion.
Smaller gainers inside the month: chemicals up 3,000, computer and electronic products up 1,300, primary metals up 1,300.
Durables hired. Nondurables did not.
Durable goods added 15,000 to 7,891,000. Nondurable goods added 1,000 to 4,747,000. Inside that near-zero nondurable print, food manufacturing shed 2,200 to 1,764,600. On the durable side, motor vehicles and parts shed 4,500 to 962,800, which means machinery and fabricated metal were not just carrying the sector, they were carrying it against a drag from autos.
Stretch the window and the divergence gets sharper. Over the year, durables are up about 72,000 while nondurables are down about 49,000. If your customer mix sits on the durable side, the labor market you are recruiting into is materially tighter than the sector average implies, and the sector average is what your compensation consultant is probably quoting you.
Reset your wage benchmark before you write another offer
Two numbers from this report get misused constantly. Here is the correction, because using the wrong one will cost you either candidates or margin.
$37.75 is not a manufacturing wage. It is average hourly earnings for all private nonfarm employees, up 10 cents (0.3%) in August and 3.1% over the year. Manufacturing average hourly earnings for all employees was $36.92 in August, up from $36.86 in July and $35.58 in August 2025, a gain of about 3.8%. Average weekly earnings in manufacturing were $1,495.26.
Neither of those is the number you build a machinist or welder offer around, because both include supervisors, engineers, and front office staff. For that, go to Table B-8, production and nonsupervisory employees:
-
Manufacturing: $30.37 an hour, $1,266.43 a week, up from $29.10 a year earlier (about 4.4%).
-
Durable goods: $32.29 an hour, $1,362.64 a week, up from $30.83 a year earlier (about 4.7%).
Note the spread. Production wages are climbing at 4.4% to 4.7% while the all private figure climbs at 3.1%. If your annual increase budget was benchmarked to the broad private number, you are falling behind the market you actually recruit in by more than a point a year, compounding.
Also note what the weekly figures imply. Divide $1,266.43 by $30.37 and you get about 41.7 paid hours. Production workers are not on a 40 hour week. Whatever you are modeling as a fully loaded annual cost per head, check it against a 41 to 42 hour reality.
One caution: average hourly earnings specific to machinery (NAICS 333) and fabricated metal (NAICS 332) are not in the news release tables. If you want subsector pay for a comp study, pull the series from the BLS data tool rather than inferring it from the sector figure.
What a 3.3% manufacturing unemployment rate means, and what it does not
The manufacturing unemployment rate was 3.3% in August, down from 3.8% a year earlier. Durable goods was 2.9% (from 3.0%) and nondurable goods 4.3% (from 5.0%). The national headline rate was unchanged at 4.1%, with 7.0 million unemployed.
Two qualifications before that becomes a slide. First, the manufacturing figure comes from Table A-14, which BLS publishes not seasonally adjusted, so it is not strictly comparable to the seasonally adjusted 4.1% headline. Second, it counts unemployed people whose last job was in manufacturing, not open manufacturing jobs.
Used carefully, it is still the cheapest available proxy for how thin your outside candidate pool is. A sector rate roughly 0.8 points below the national rate, with durable goods nearly a point and a half below, tells you that experienced people with your exact background are not sitting available in volume. Your local labor shed may be tighter or looser, but you should not plan a hiring ramp on the assumption that the national slack applies to you.
Overtime at 3.1 hours: hire, or keep running premium time?
Hours move before headcount does, and hours moved. Manufacturing average weekly hours rose to 40.5 in August from 40.4 in July and 40.0 in August 2025. Overtime held at 3.1 hours a week against 2.9 a year ago. Durable goods ran 41.0 hours with 3.1 hours of overtime.

Three tenths of an hour sounds trivial. Run the arithmetic on a crew. Fifty production workers at 3.1 overtime hours a week is 155 premium hours, close to four full-time equivalents at 40 hours, being covered by people you already employ.
The decision rule is simple even though the inputs are yours. An overtime hour costs 1.5 times base wage plus payroll taxes on the premium, but adds no new benefits enrollment, no recruiting cost, and no onboarding curve. An incremental hire costs the $30.37 base ($32.29 in durables) plus your full benefits and burden load, plus the requisition and ramp. Below roughly a 50% burden load, the hire wins on cash cost per productive hour. Above it, overtime wins until fatigue, quality escapes, or retention risk breaks the tie. Sector average overtime at 3.1 hours is a reasonable trigger line: if your plant is running meaningfully above it and has been for a quarter, you are financing a headcount decision you have not made.
Openings up 35%, quits flat: what the JOLTS is telling you
The July JOLTS, released Sept. 1, is where the operator signal is clearest. Manufacturing job openings were 580,000, a 4.4% rate, against 428,000 and 3.3% a year earlier, a 35% increase. Durable goods openings hit 429,000 at a 5.2% rate, nearly double the 255,000 and 3.2% of July 2025, with 76,000 of that added in the month alone. Nondurable openings fell to 151,000 from 172,000, which is the same durables and nondurables split showing up on the demand side.
Now the other half. Manufacturing quits were 180,000 in July, a 1.4% rate, essentially unchanged from 174,000 and 1.4% a year earlier.
Openings up 35% with a flat quits rate is a specific diagnosis. Incumbent workers are not moving between plants at any greater rate than last year. The additional demand for labor is not being met by churn inside the sector, which means the marginal hire has to come from outside manufacturing or from people entering the workforce. Practically: bidding against the shop across town for the same welder is competing for a pool that is not growing. The money is better spent on training capacity, apprenticeship slots, and a pipeline you control, and on shortening your own time-to-offer so you win the candidates who do enter.
The counterweight
ISM's August Manufacturing PMI was 54.6%, an eighth straight month of expansion, but down 1.0 point from July. The Employment Index fell 1.6 points to 51.2%, barely above the neutral line. New Orders fell 3.0 points to 53.7%. Production held at 58.3% and Prices stayed elevated at 71.1%. Seven of 18 manufacturing industries reported employment growth and three reported declines. ISM chair Susan Spence noted the ratio of panelist comments about hiring versus managing or reducing head counts was 1.3 to 1.
A 1.3 to 1 hiring ratio is a majority, not a wave. Read alongside the payroll data, the picture is expansion that is decelerating, with orders cooling faster than production. That is the sequence that shows up in headcount two or three quarters later.
Sentiment from manufacturers themselves is middling rather than bullish. NAM's Q2 2026 Outlook Survey, fielded May 12 to 28, put optimism at 74.2%, essentially at the 74.3% historical average. Respondents projected 3.3% sales growth and 3.0% production growth over the next twelve months, and cited raw material costs (83.1%), healthcare costs (76.8%) and trade uncertainty (71.8%) as top challenges.
Caveats to apply before you act on one month
Single months are noise. July manufacturing payrolls were initially reported at +5,000 and revised up to +14,000. The number you reacted to in early August was wrong by nearly threefold.
The level itself is under revision. BLS released its preliminary benchmark revision on Aug. 28, estimating that total nonfarm employment through March 2026 was overstated by 79,000 (0.1%), and total private by 178,000. Official estimates do not incorporate the final benchmark until the January 2027 report lands in February 2027.
This is a round trip, not a boom. Manufacturing is up 58,000 from its December 2025 low, but only about 23,000 above August 2025. The sector has recovered to roughly where it was a year ago. Scott Paul of the Alliance for American Manufacturing called the report "nice momentum after significant drops over the past few years," adding that "factory hiring is steadily rounding into form, which is good news for workers," while flagging interest rates, China policy and energy price shocks as headwinds. Momentum after a drop is the right frame.
An operator's checklist
-
Reprice production wage bands now, not at annual review. Benchmark against $30.37 an hour in manufacturing and $32.29 in durable goods, and against 4.4% to 4.7% year over year movement, not the 3.1% all private figure.
-
Audit your overtime against 3.1 hours a week. Sustained overtime meaningfully above the sector average is a hiring trigger you have been deferring. Run the burden math and make the call deliberately.
-
If you hire on the durable side, lengthen your requisition timeline. A 5.2% openings rate with a flat 1.4% quits rate means fewer available candidates per posting than a year ago, and no help coming from churn.
-
Budget for pipeline over poaching. The supply is not in the shop across town. Apprenticeships and internal training compete for a pool that is actually growing.
-
Do not build a 2027 capex case on one payroll print. Cooling new orders (53.7%) and a barely expansionary employment index (51.2%) belong in the same memo as the +16,000.
Related reading
-
Which Industrial AI Demos at IMTS Are Ready for a Plant Floor?
-
Amazon Plans to Hire Welders for Its Greenwood, Indiana Plant
Sources
-
Employment Situation Summary, August 2026, BLS, released Sept. 4, 2026
-
Table B-3: Average hourly and weekly earnings of all employees, BLS
-
Table B-8: Average hourly and weekly earnings of production and nonsupervisory employees, BLS
-
Table A-14: Unemployed persons by industry and class of worker, BLS
-
Job Openings and Labor Turnover Survey, July 2026, BLS, released Sept. 1, 2026
-
JOLTS Table 1: Job openings levels and rates by industry, BLS
-
[Manufacturing PMI at 54.6%, August 2026 ISM Manufacturing PMI Report](https://www.prnewswire.com/news-releases/manufacturing-pmi-at-54-6-august-2026-ism-manufacturing-pmi-report-302865127.html)
-
US manufacturing adds 16,000 jobs in August, Manufacturing Dive
-
Preliminary Benchmark Revision to Establishment Survey Data, BLS, released Aug. 28, 2026
-
Advance Report on Durable Goods Manufacturers' Shipments, Inventories and Orders, July 2026, Census Bureau