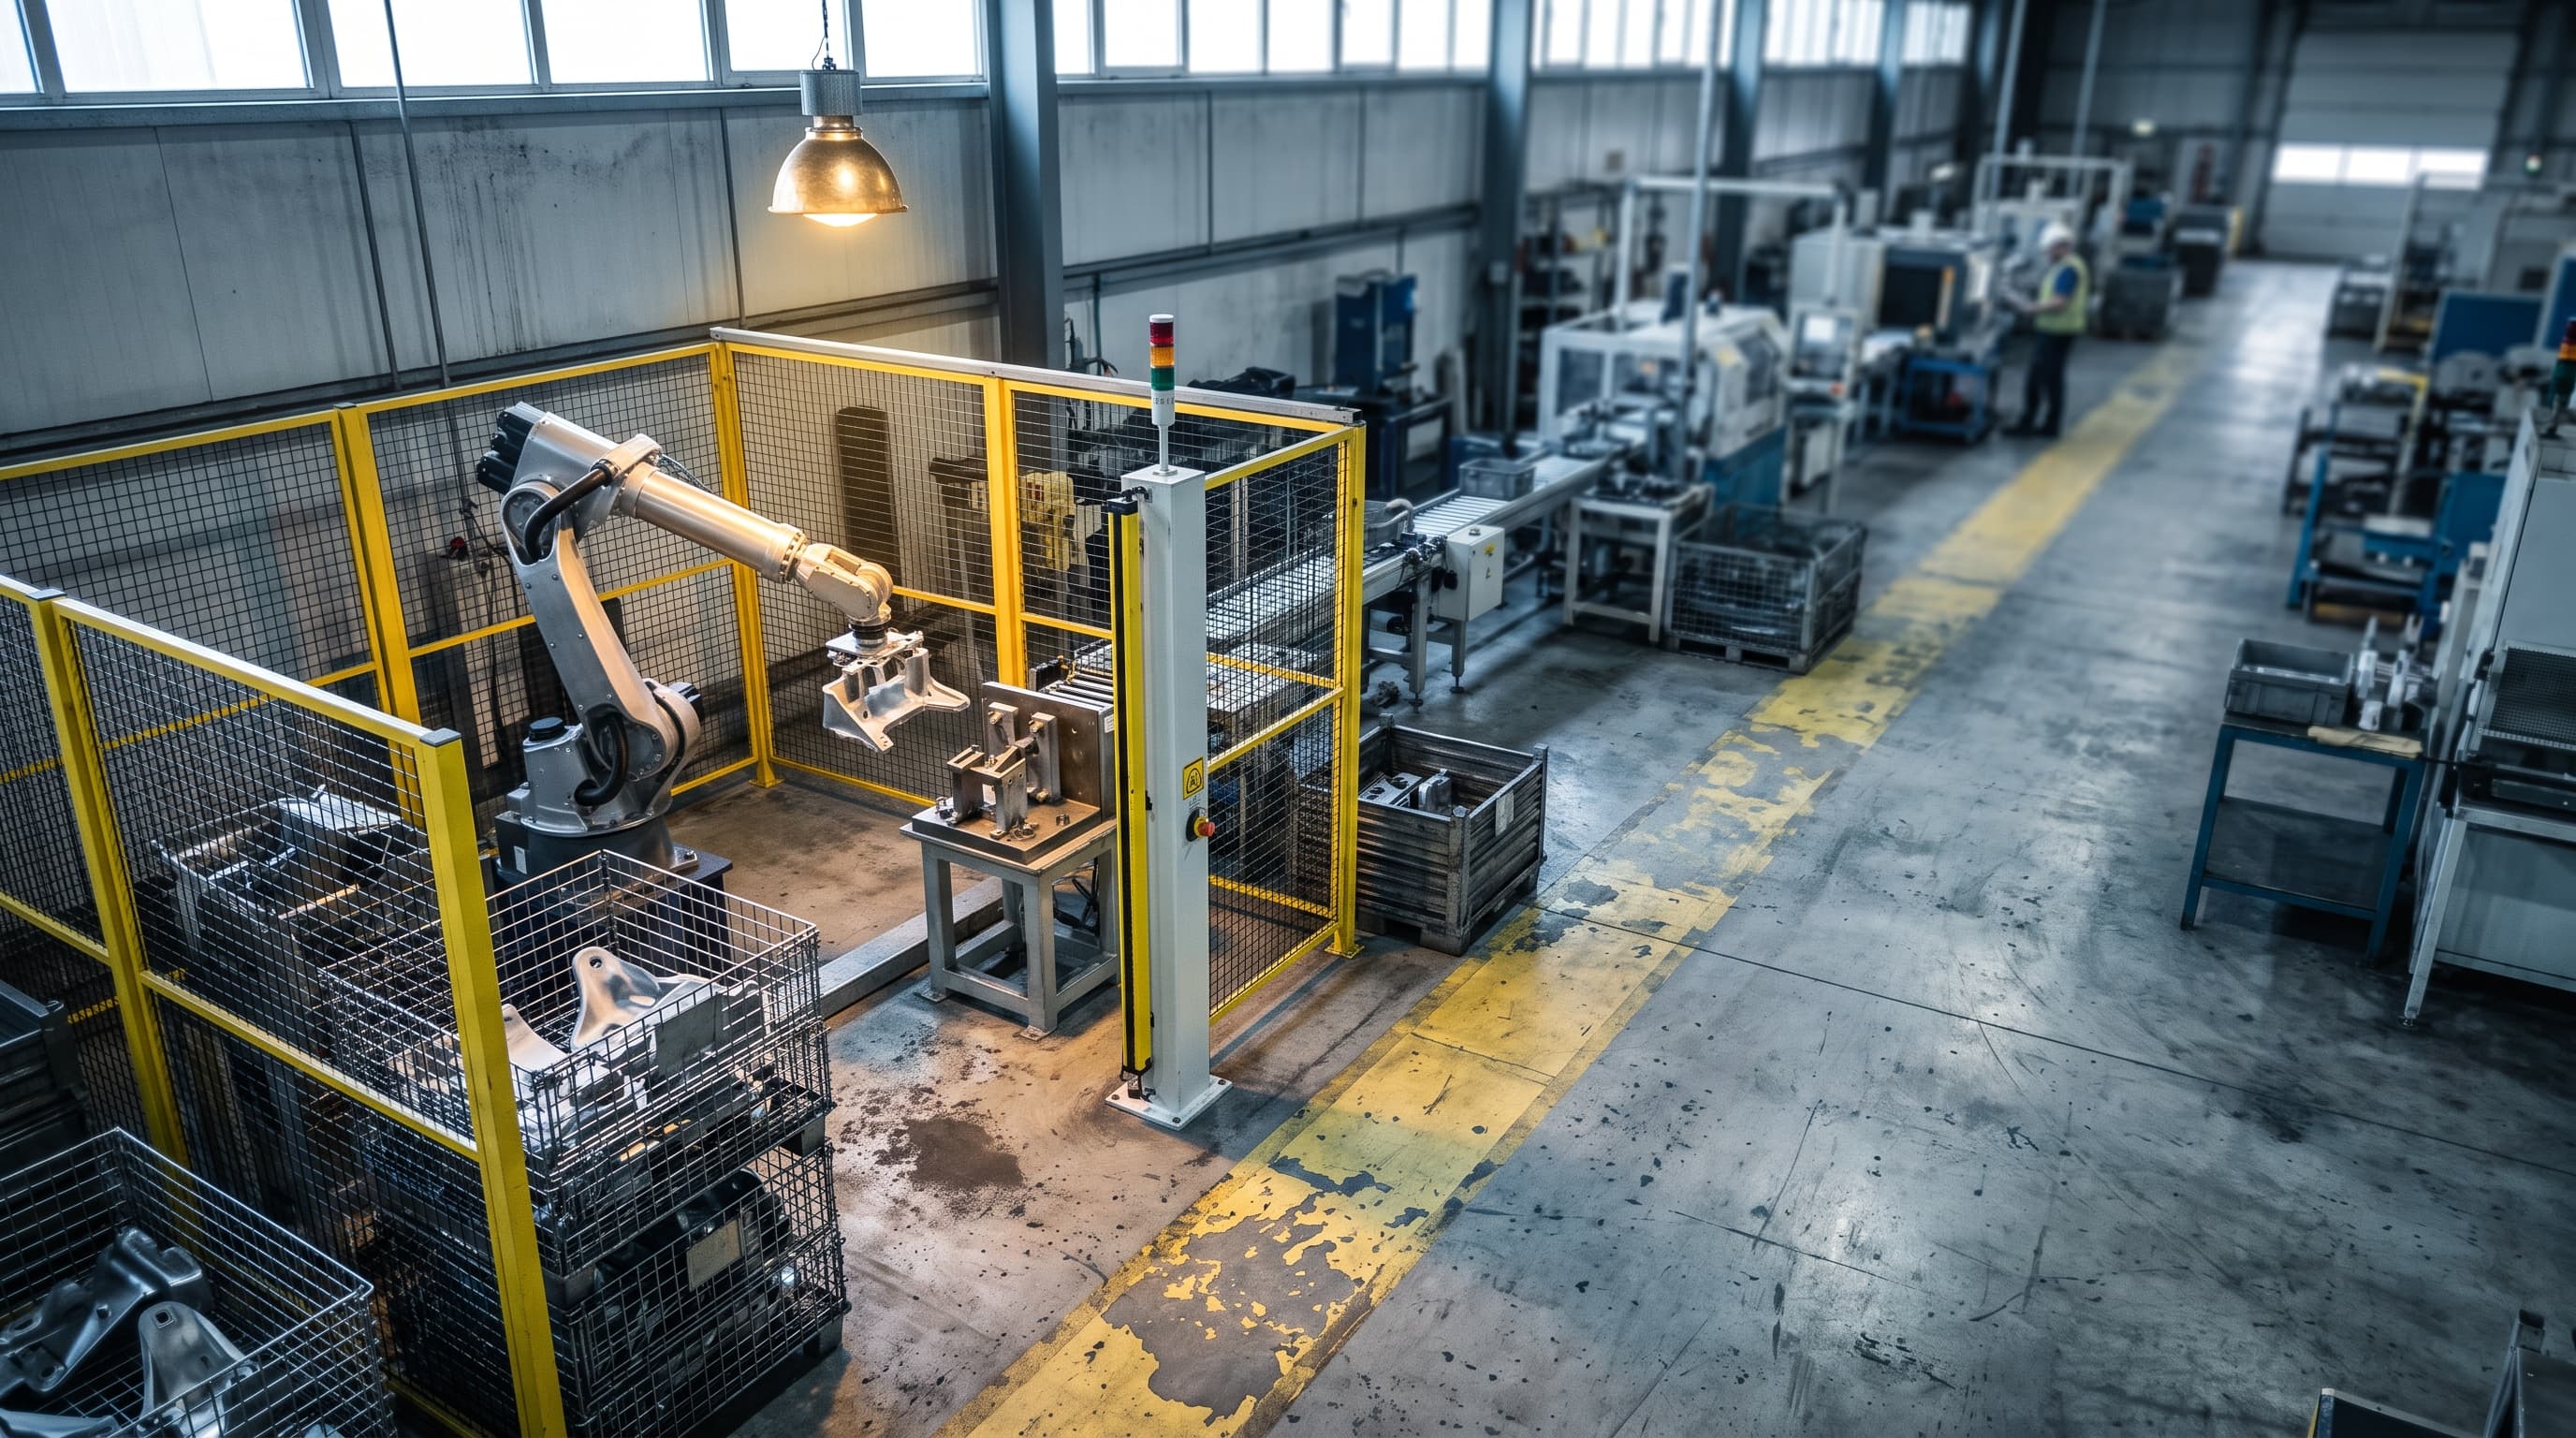
Toyota told investors earlier this month that modernizing its factories could cost roughly 1 trillion yen a year from 2028, about $6.4 billion at the 157.18 yen rate Reuters used, and could require about 400,000 robots. The total belongs to Toyota. The number everyone else can use is what falls out when you divide: an implied factory automation investment per robot of 2.5 million yen, roughly $15,900, per unit per year. That per-unit rate is the only part of this announcement a plant manager can carry into a quote review.
What Toyota said, and what it did not say
Reuters reported the estimate on September 18, 2026 from Tokyo (Daniel Leussink). The discussion itself happened earlier in the month, at a Toyota Motor Europe technology briefing where the company demonstrated its in-house robot. Three caveats need to survive any retelling.
First, Toyota has not committed to the money. Reuters is explicit that the company described the estimate without specifying whether it would definitely take place or for how many years. Treat it as a planning estimate, not a budget line.
Second, the scope is wider than Toyota's own plants. The figure covers Toyota, its group companies, and major suppliers. Of the 400,000 units, roughly 150,000 land at Toyota's own facilities and roughly 250,000 at group companies and supplier or partner sites, according to trade coverage from Automotive World.
Third, and this is where a lot of coverage went wrong: the 400,000 figure is not 400,000 humanoids. Reuters describes a mix of humanoid and non-humanoid machines, including replacements for equipment Toyota already runs and new installations. ASSEMBLY Magazine reads the same facts as spanning industrial robots, automated material handling, and future human-robot collaboration. Several outlets framed it as a humanoid fleet. It is a refresh of an entire industrial base with some humanoid content in it, which is a very different capital story.
Why you divide by robots, not by plants
The tempting arithmetic is 1 trillion yen across the roughly 60 plants in Toyota's group footprint. That division does not hold. The 60-plant number is group-wide, while the 250,000 supplier-side units sit at companies outside that footprint entirely. You would be dividing one population's money across a different population's sites.
Dividing by units does hold, because the unit count and the spend describe the same program. 1 trillion yen over 400,000 robots is 2.5 million yen each per year. Running it in dollars gives the same answer: $6.4 billion over 400,000 is $16,000. Call it $15,900 to $16,000 per robot per year.
Backing out an installed cost per unit
An annual rate is not a price tag until you attach a service life. If $15,900 a year is a steady-state run rate against fleet turnover, then installed cost per unit is that rate times the turnover period. Industrial equipment cycles on roughly seven to ten years in this kind of program, so the range looks like this.
| Assumed turnover | Implied installed cost per unit | Versus A3 average robot price | | --- | --- | --- | | 7 years | about $111,000 | 1.6x | | 8 years | about $127,000 | 1.8x | | 9 years | about $143,000 | 2.1x | | 10 years | about $159,000 | 2.3x |
Read that as an upper bound. Toyota's modernization budget also absorbs facility renewal that has nothing to do with robots: floors, power, conveyance, controls. Some share of the 2.5 million yen is building, not machine.
The market benchmark it is measured against
North American firms ordered 8,940 robots worth $622 million in Q2 2026, per data from the Association for Advancing Automation (A3) as reported by The Robot Report. That is an average of $69,575 per robot. First-half 2026 came in at 17,995 units and $1.166 billion, or $64,796 average. Those are robot-only figures. No tooling, no end effector, no guarding, no safety validation, no integration labor.
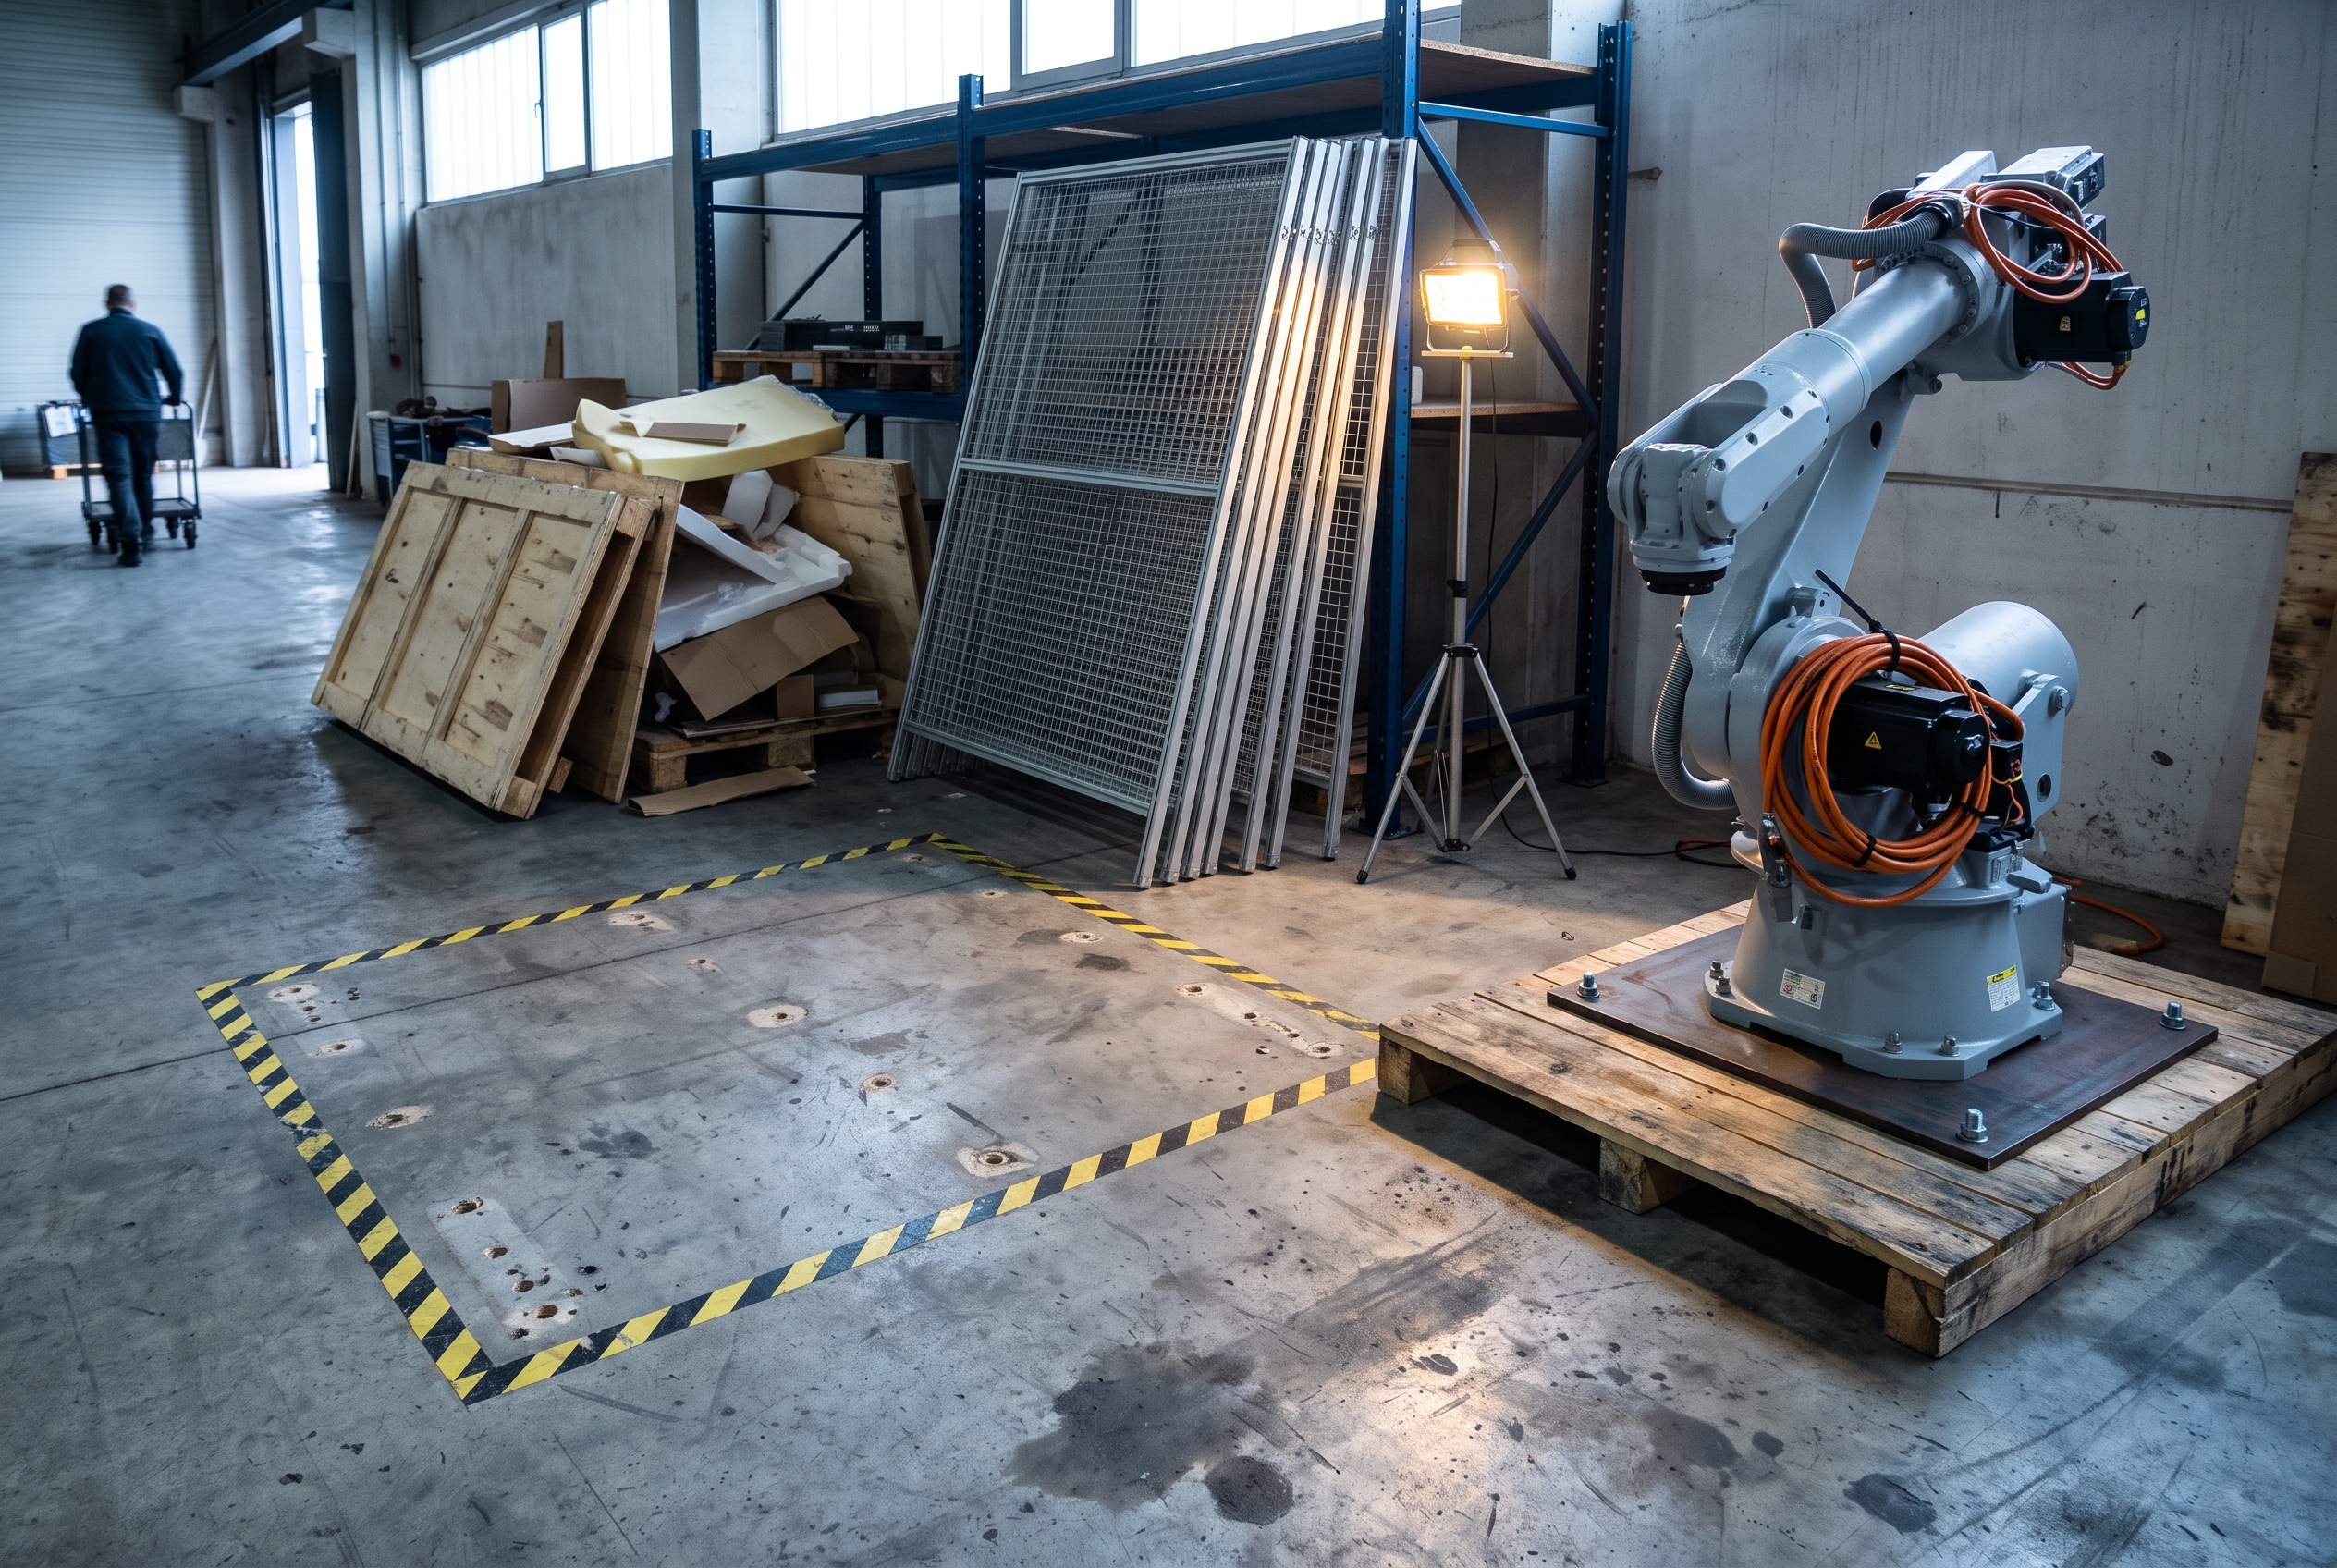
So Toyota's implied $111,000 to $159,000 per installed unit sits at roughly 1.6x to 2.3x the bare arm price. That gap is the cell, not the robot. We are not printing a tidy integration multiplier here, because the rules of thumb circulating online are mostly vendor marketing and we have not put one to a named integrator on the record. The directional takeaway stands on its own and is the practical one: if an integrator quotes you a turnkey cell at something close to the arm price, scope is missing from the quote. Find out what.
A worked payback for a tier-2, with the assumptions on the table
Here is the model with every input stated, so you can swap your own numbers in.
-
Installed cell: $130,000, the midpoint of the implied range above.
-
Labor rate: $48.62 per hour worked, total compensation for manufacturing, June 2026 reference period, from the BLS Employer Costs for Employee Compensation release of September 9, 2026 ($32.50 wages plus $16.12 benefits). One single-shift position at 2,080 hours costs about $101,100 fully burdened.
-
Annual run cost: 10 to 15 percent of capital for spares, programming, preventive maintenance and integrator support. At 12.5 percent on $130,000 that is about $16,300 a year.
The gross number: $130,000 divided by $101,100 is 1.29 years, about 15 months. This is the number that shows up in vendor slides, and it is wrong because it ignores what the cell costs to keep running.
The honest single-shift number: net annual saving of $101,100 less $16,300 is $84,800. Payback is 1.53 years, about 18 months.
The honest number when the cell does not displace a whole head: most first cells capture 70 to 80 percent of a position, because someone still loads, clears faults and inspects. At 80 percent capture, saving drops to about $80,900 gross and $64,600 net. Payback moves to 2.0 years.
What two shifts do: the capital does not change and the run cost rises only modestly, so the economics change character. Two positions at $48.62 across 4,160 hours is about $202,300 a year. At 80 percent capture and $19,500 in run cost, net saving is about $142,300 and payback falls to roughly 11 months. The single largest lever on a robot's payback is not the robot. It is whether the cell runs on the second shift.
If your justification rests on uptime rather than headcount, run the avoided downtime through our free downtime cost calculator first and separate lost contribution margin from incremental recovery cost before you put a number in the capital request. Those two get conflated constantly, and it inflates the case in a way a CFO will find.
The tax line most payback models leave out
100 percent bonus depreciation under IRC section 168(k) was restored and made permanent by the One Big Beautiful Bill Act for property acquired and placed in service after January 19, 2025. The 2026 Section 179 expensing cap is $2.56 million with a $4.09 million phase-out threshold.
On the $130,000 cell, expensing the full basis in year one at a 21 percent federal rate reduces tax by about $27,300, so the effective first-year outlay is closer to $102,700. Against the $84,800 single-shift net saving, payback compresses from about 18 months to about 15 months. Roughly three to four months come off the model from the tax treatment alone.
Two disclaimers that matter. This is a federal-rate illustration, not tax advice, and it assumes you have the taxable income to absorb the deduction. State conformity to bonus depreciation varies, and several states decouple from 168(k) entirely. Confirm the current Section 179 figures against the IRS revenue procedure with your accountant rather than a tax-prep blog, and run the after-tax case before the pre-tax one goes in front of your board.
Turning Toyota's rate into a benchmark you can hold a quote against
Convert $15,900 a year into labor at the BLS manufacturing rate and it equals 327 fully burdened hours. A two-shift operator-year of 4,160 hours costs about $202,300. So Toyota's implied annual cost per robot is under 8 percent of one two-shift position.
That is a useful yardstick and a dangerous one to copy. Toyota builds its own robots, buys at group scale, amortizes across a standardized process fleet, and pays Japanese wages for much of the affected labor rather than the US figure above. A tier-2 buying three cells from an integrator has none of those advantages. Use the ratio as a sanity check on direction, not as a target. If your quote implies an annual cost near half an operator-year, the case had better rest on quality, throughput or safety rather than headcount.
What actually lands on suppliers, and when
The supplier split is the real news in this story. 250,000 of the 400,000 units sit outside Toyota's own walls, at group companies and partners. Whether a customer asks you to fund that directly or expects it absorbed through piece price, it belongs in the capex plan you write in 2027 for a 2028 start.
The order data suggests the tier is already moving ahead of the assemblers. In the first half of 2026, North American automotive OEM robot orders fell 25 percent while automotive component orders rose 24 percent in units. Component suppliers are automating faster than the people they ship to.
The US exposure is concrete rather than abstract. Toyota's official North American facilities list, updated May 8, 2026, shows 14 manufacturing entities in the region: 11 in the United States across Kentucky, Indiana, Texas, Mississippi, Alabama, West Virginia, Missouri, Tennessee, TABC in California, Mazda Toyota in Alabama and Toyota Battery Manufacturing in North Carolina, plus one in Canada and two in Mexico. The supply bases feeding those plants are where a 2028 modernization expectation would show up first.
The workforce pressure that makes this live is not theoretical either. In NAM's Q3 2026 Manufacturers' Outlook Survey, more than 54.9 percent of respondents named attracting and retaining talent as their primary business challenge.
Lead time and price risk
Look again at the A3 numbers. Q2 2026 units rose 4.3 percent year over year while order value rose 21.3 percent. Price and mix are moving against small buyers. The cheap end is growing in count but not in dollars: collaborative robots were 2,774 units in the first half, 15.4 percent of units, but only $114 million, 9.8 percent of value.
Now add a potential 400,000-unit program with a 2028 start date. Even if Toyota executes a fraction of it, that is a queue, and a tier-2 ordering two cells in 2028 may be standing behind it for integrator capacity, not just for hardware. Two practical moves: lock integrator engineering capacity with a dated purchase order rather than a verbal slot, and negotiate spares and service pricing at the time of the cell order, when you still have leverage, instead of at the first breakdown.
What would have to be true for the number to hold
Toyota has not committed to this spend, and its own robotics work is early. The company's robot is ELEY, for Embodied Learning robot for Enhanced Yield: roughly 50 kg, a wheeled base, a two-fingered gripper, and quasi-direct-drive actuators chosen for backdrivability. Workers wear finger-shaped jigs modeled on the robot's hands and repeat a task so the machine learns by demonstration. It folded T-shirts with near-perfect accuracy after about 1,500 practice sessions over two weeks, drawing on a skill base Toyota puts at roughly 18,000 veteran takumi workers.
Toyota's own Frontier Research page, dated March 31, 2026, names the open problems without spin: reliability over long production runs, positional repeatability, and the data infrastructure required for robot learning. Those three are the difference between a demonstration and a production asset. Folding a T-shirt is compliant, forgiving, and tolerant of a few millimeters of error. A torque-controlled fastening operation with a documented quality record is none of those things.
Hiroki Nakajima, Toyota's executive vice president and CTO, framed the program this way: "We aim for a world where robots coexist with humans, rather than replacing them." For the estimate to hold, learned-behavior robots would have to clear repeatability and uptime thresholds they have not yet cleared publicly, and the supply base would have to absorb 250,000 units on a timeline it has not agreed to.
The three questions for your next quote
Forget the trillion. On the next cell proposal that crosses your desk, ask the integrator:
-
What share of this price is the arm? If it is much more than half, ask what integration scope was excluded. If it is a small fraction, ask what is driving the balance and whether any of it is a one-time engineering cost you would not repeat on cell two.
-
What service life are you assuming? Your depreciation schedule and their spares plan should match. A seven-year answer and a ten-year schedule is a gap someone eats later.
-
What is the annual run cost? Get spares, programming support and preventive maintenance quoted as a percentage of capital, in writing, before signing. It is the input most payback models omit, and it is the one that decides whether 18 months is real.
Toyota's estimate is worth exactly one thing to a mid-market manufacturer: it is a large, sophisticated buyer publishing an implied per-unit rate. Use it as a reference point, then build your own case on your own labor rate, your own shift pattern, and your own tax position.
Related reading
-
Why Did Factory Output Slip in August After Seven Straight Gains?
-
Lease or Buy the Next CNC Machine After the Fed's Rate Hike?
Sources
-
Toyota estimates factory automation could cost $6.4 billion per year from 2028, Reuters wire text, Daniel Leussink, Tokyo, September 18, 2026
-
Toyota plans to deploy 400,000 factory robots from 2028, Automotive World
-
Toyota estimates factory automation could require 400,000 robots, ASSEMBLY Magazine
-
Changing the future through gentle touch, Toyota Frontier Research, March 31, 2026
-
Q2 2026 robotics demand increased across industries, reports A3, The Robot Report, reporting data originated by the Association for Advancing Automation
-
Employer Costs for Employee Compensation, June 2026, US Bureau of Labor Statistics, released September 9, 2026
-
Facts About Manufacturing, National Association of Manufacturers, Q3 2026 Manufacturers' Outlook Survey
-
Manufacturing worldwide: North America, Toyota Motor Corporation, updated May 8, 2026
Payback and tax figures in this article are illustrations built from the stated public data, not advice on a specific purchase. Confirm depreciation treatment with your tax advisor.