
The Federal Reserve's industrial production August 2026 report, released September 18, ended a streak that operators had started to take for granted. According to the Fed's G.17 release, "Manufacturing output decreased 0.3 percent in August after increasing for seven consecutive months." Total industrial production was unchanged (0.0%) after a 0.2% gain in July, and it held flat only because utilities rose 1.8% and mining edged up 0.1% while factories pulled back.
The miss was meaningful. Consensus expectations compiled by investingLive called for manufacturing to rise 0.3% and total industrial production to rise 0.3%. Reported coverage described August as the first manufacturing decline of 2026. Even so, total industrial production stood at 103.1% of its 2017 average, 1.4% above a year earlier, per the ABA Banking Journal. This is a soft month, not a collapse, and the figures are preliminary: the Fed routinely revises prior months.
Where the drop came from
Durable goods did the damage. Durable manufacturing fell 0.5%, with what the Fed called "broad-based declines across categories." Nondurable manufacturing was flat.
Fed Table 1 shows the biggest movers:
-
Motor vehicles and parts: down 1.2% in August, after 0.0% in July.
-
Aerospace and miscellaneous transportation equipment: down 1.2%, reversing a 0.7% gain in July.
-
Computer and electronic products: down 0.5%.
-
Primary metals: down 0.3%, after a 1.9% drop in July.
-
Fabricated metals: down 0.1%.
-
Electrical equipment and chemicals: both flat.
-
Machinery: up 0.5%.
By market group, the automotive products group fell 1.0% (after a 1.3% drop in July), business equipment fell 0.5%, defense and space equipment fell 1.2%, and construction supplies fell 0.7%. Consumer goods rose 0.1% and materials rose 0.2%. One note on sourcing: the ABA Banking Journal reported defense and space equipment at minus 1.8%, but the Fed release shows minus 1.2%, and we use the Fed figure.
It is tempting to read this as a model-changeover blip in autos. The data does not support that reading on its own. The ABA Banking Journal reports that manufacturing excluding motor vehicles and parts still edged down 0.2%. Autos were the largest single drag, but the softness reached beyond the vehicle supply chain.
The exception: machinery
Machinery rose 0.5% in August and ran at 83.4% utilization, up from 83.0% in July and well above its 1972-2025 average of 78.2%, according to Fed Table 7. Capital-equipment makers are in a very different position from vehicle suppliers. A machinery shop running five points above its long-run utilization rate is dealing with lead times and scheduling pressure, while an auto parts plant is dealing with idle hours. Operators who serve both markets should not average the two signals into one plan.
What 75.7% utilization means on the floor
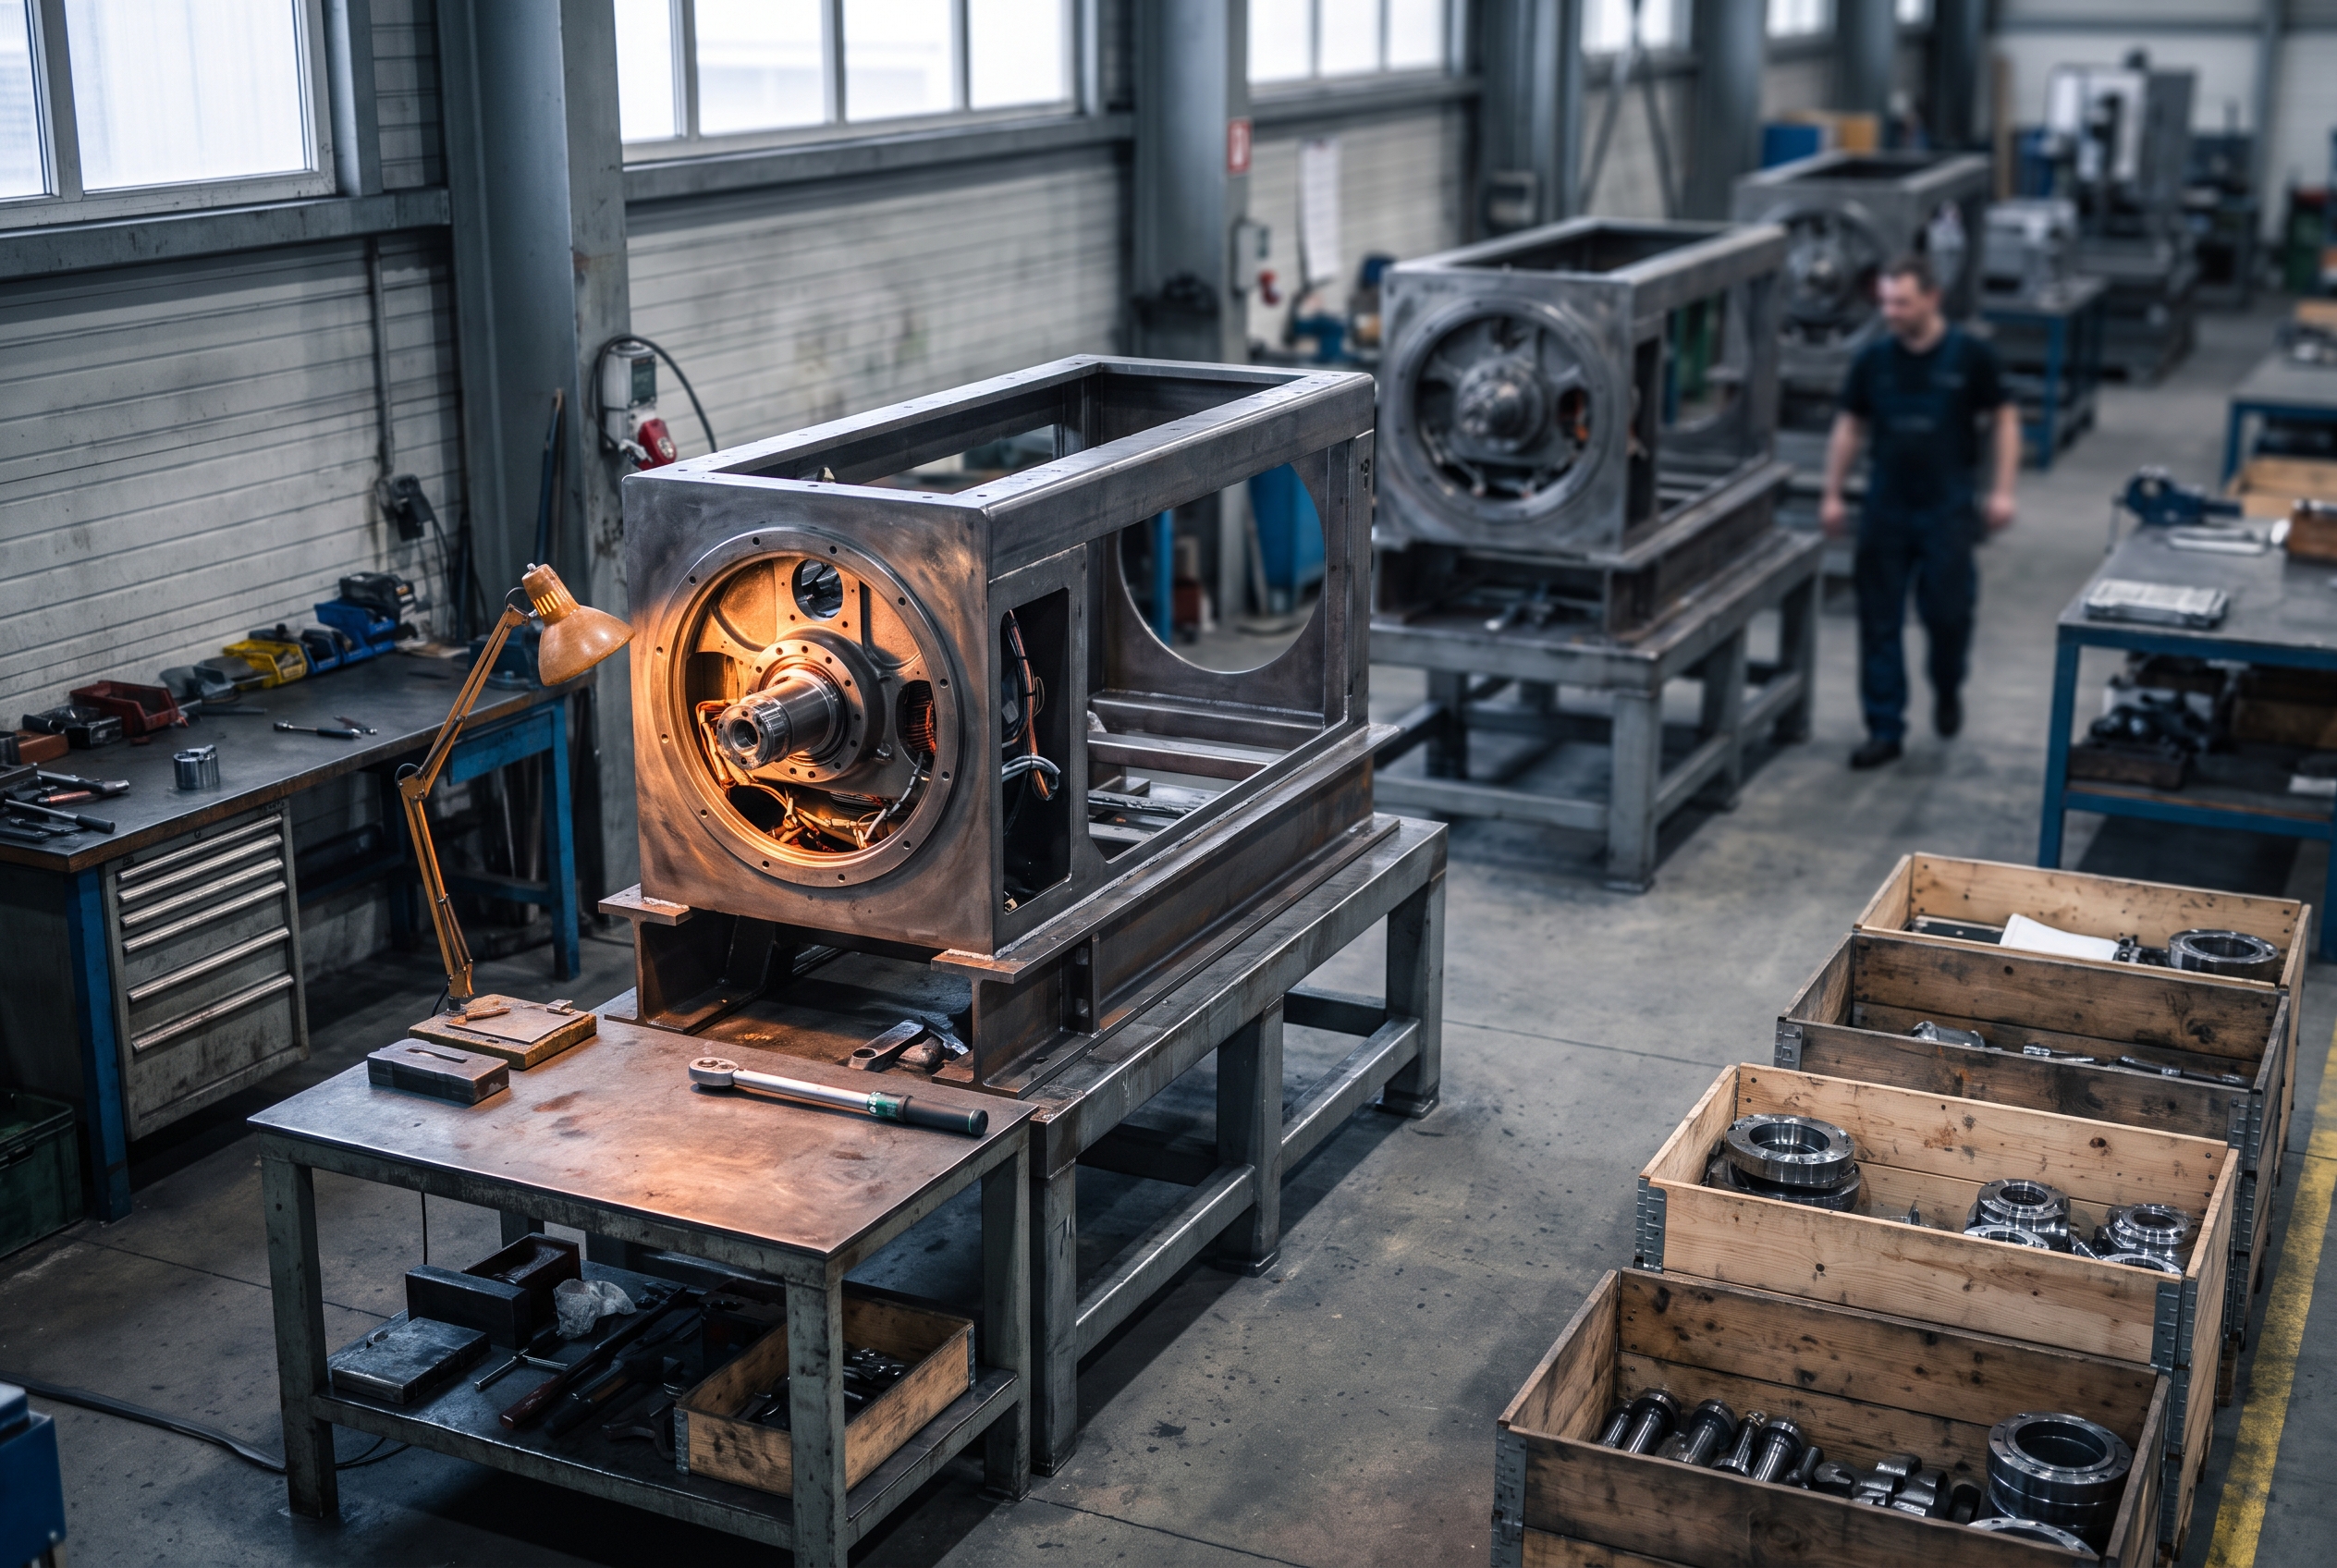
Capacity utilization measures output as a share of sustainable capacity: roughly, how much of the plant a manufacturer can run on a realistic, repeatable schedule is actually in use. It is a better gauge of margin pressure than output alone, because fixed costs (depreciation, salaried staff, facility overhead) do not shrink when volume does.
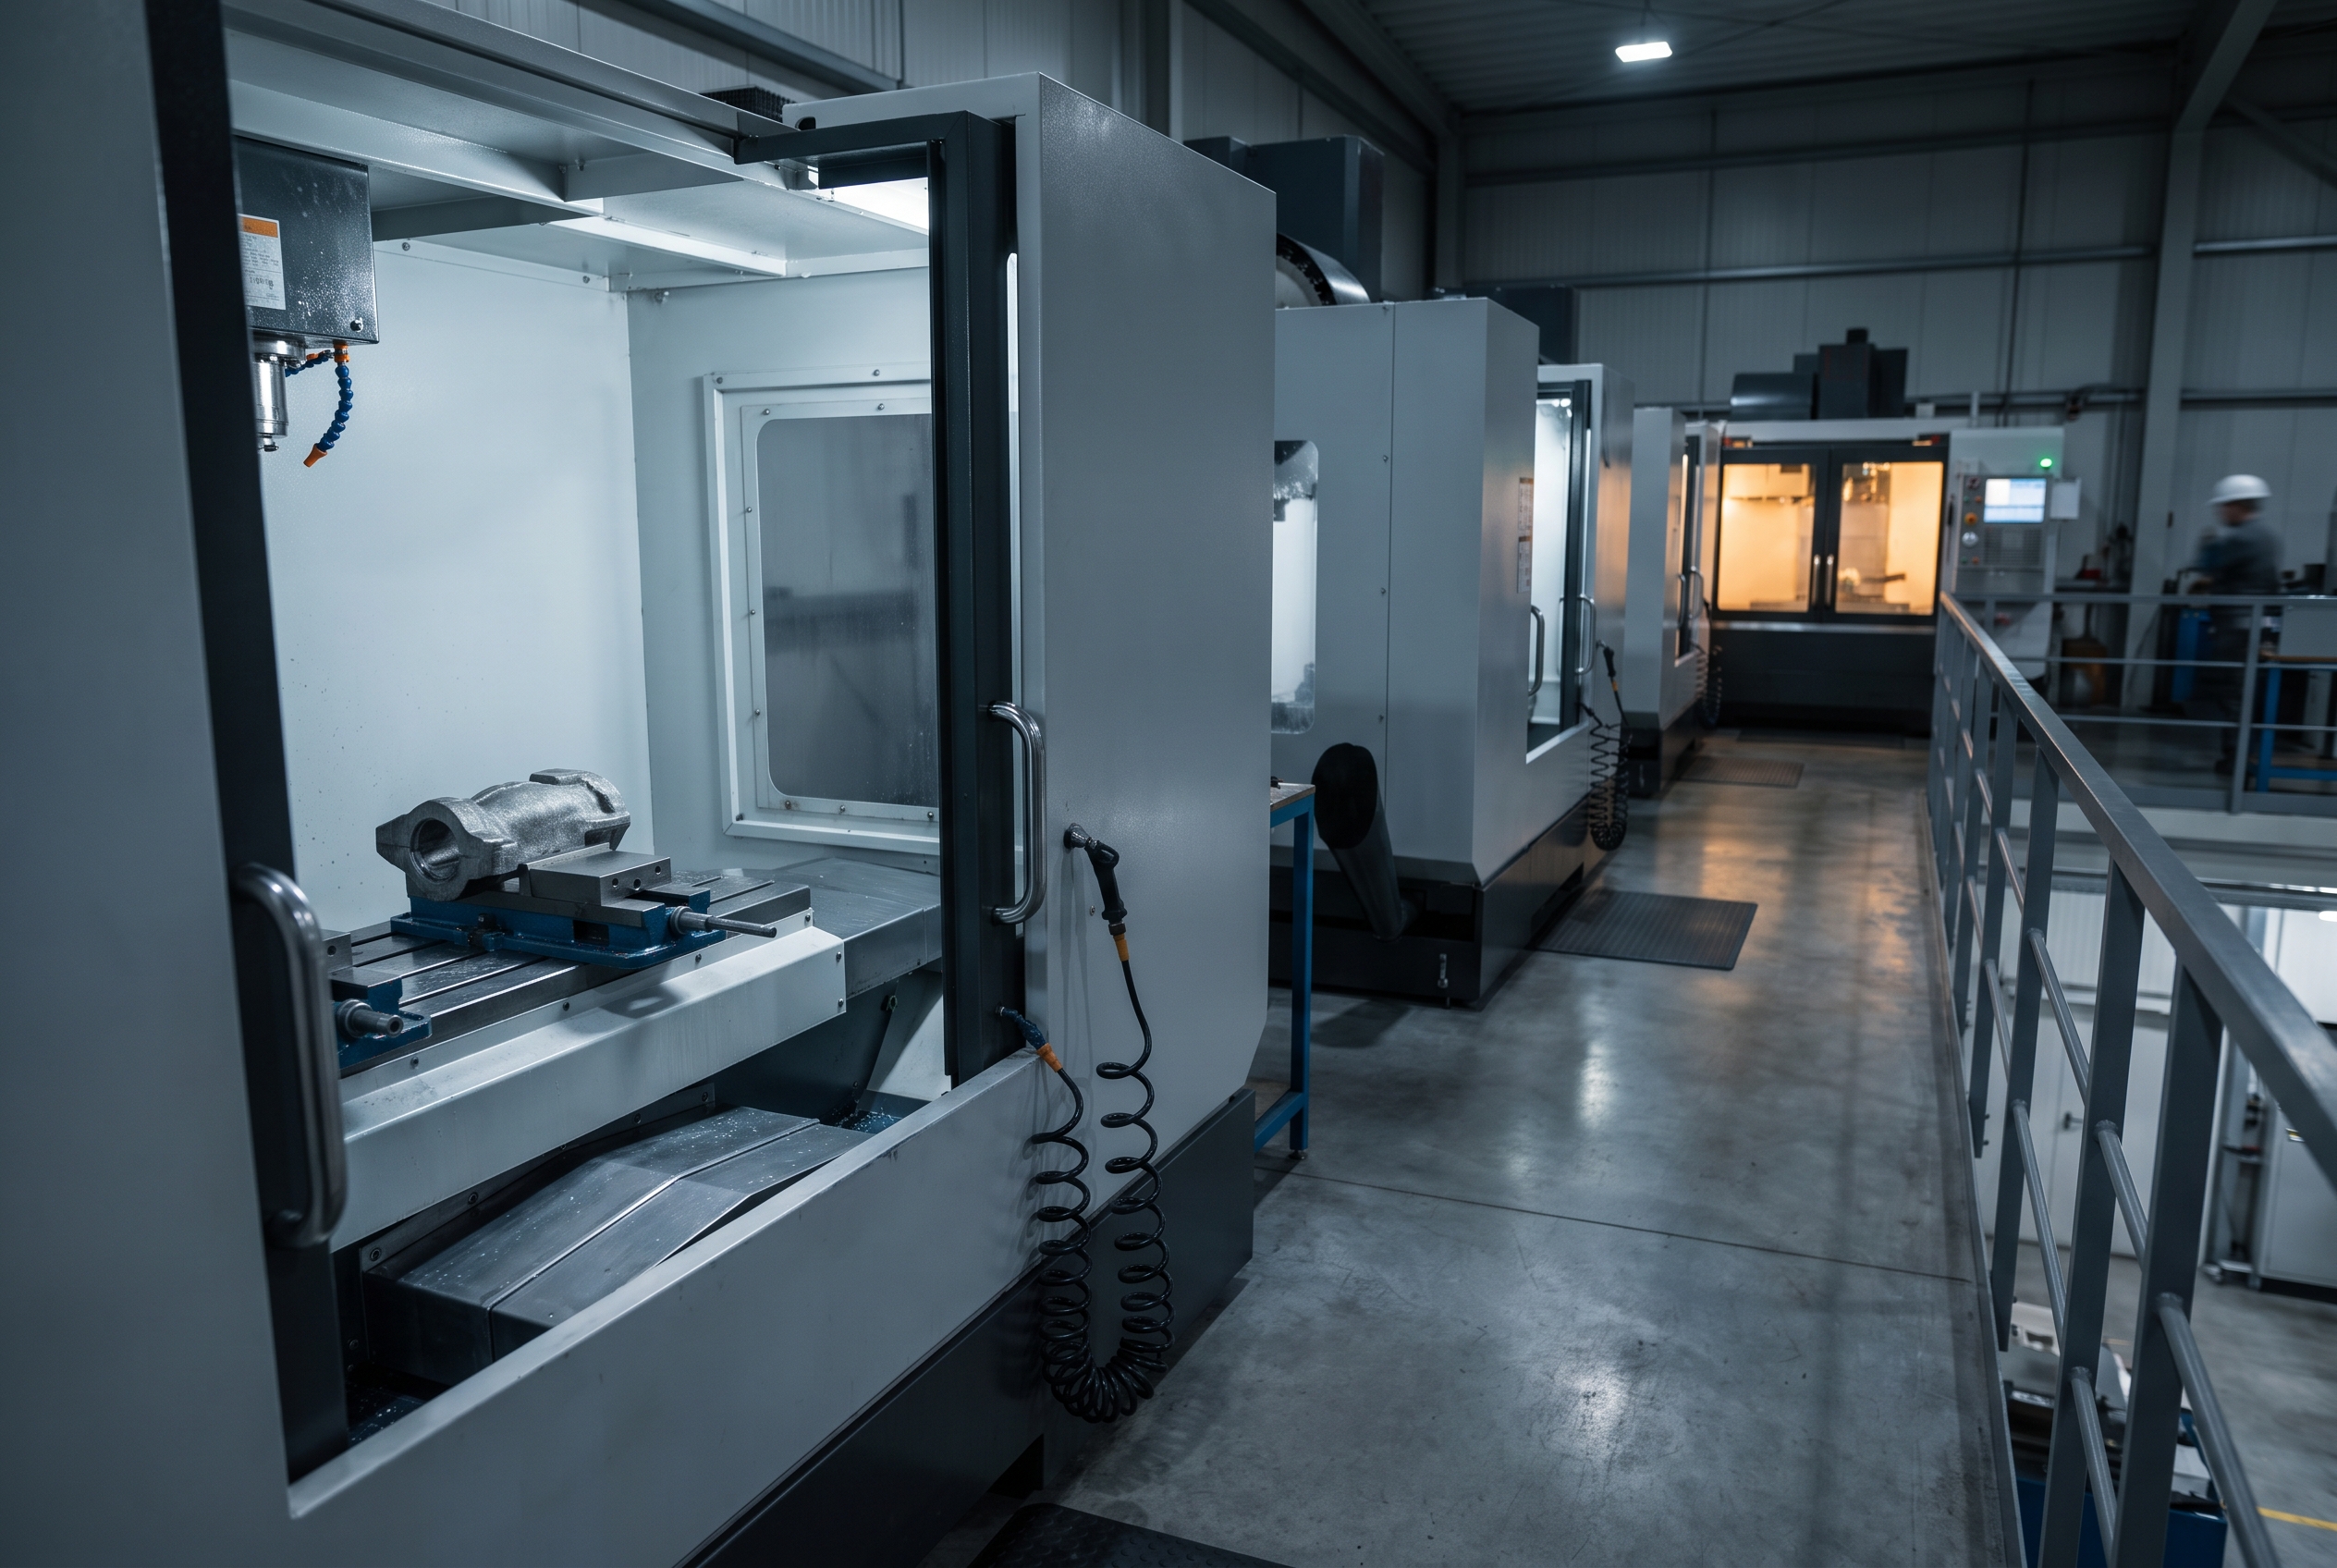
The August readings from Fed Table 7, with 1972-2025 averages in parentheses:
| Industry | August | July | Long-run average | | --- | --- | --- | --- | | Total industry | 76.3% | | 79.4% | | Manufacturing | 75.7% | 76.0% | 78.2% | | Durable manufacturing | 75.8% | | 76.7% | | Motor vehicles and parts | 69.0% | 69.9% | 74.4% | | Aerospace and misc. transportation | 73.4% | 74.4% | 73.4% | | Machinery | 83.4% | 83.0% | 78.2% | | Primary metals | 67.3% | | 77.1% | | Fabricated metals | 78.3% | | 78.5% | | Nondurables | 75.6% | | 79.9% |
Manufacturing as a whole sits 2.5 points below its long-run average. Motor vehicles and parts, at 69.0%, are 5.4 points below theirs. When auto utilization runs below 70%, OEMs and their suppliers are spreading fixed costs over too few units, which is exactly when purchasing departments push harder on piece prices and payment terms. Tier suppliers should expect that pressure to flow downstream.
Aerospace slipped back to exactly its long-run average of 73.4%, from 74.4% in July. Primary metals, at 67.3% against a 77.1% average, remain the most underused of the major durable industries in the table. Fabricated metals, at 78.3%, are running essentially at their norm.
Total industry utilization of 76.3% was close to the 76.4% consensus, so the surprise was concentrated in factory output rather than in the overall capacity picture.
Hard data versus the survey
The ISM August 2026 Manufacturing PMI report tells a softer but still positive story. The PMI came in at 54.6, down from 55.6 in July, marking an eighth straight month of expansion. The production index held at 58.3, down just 0.2 points.
So survey respondents said production was still growing while the Fed's hard data showed factory output falling. That gap matters less than the leading indicators inside the ISM report:
-
New orders: 53.7, down 3.0 points.
-
Backlog of orders: 51.8, down 3.2 points.
-
Employment: 51.2, down 1.6 points.
-
Inventories: 50.6, down 0.6 points.
-
Supplier deliveries: 59.3 (a reading above 50 indicates slower deliveries).
-
Prices: 71.1, unchanged.
Put together, this is a margin squeeze setup for tier suppliers. Order books and backlogs are thinning, which reduces the volume that absorbs fixed costs. At the same time, input prices are still rising at a rapid pace and suppliers are still delivering slowly, which pushes buyers to carry safety stock. ISM transportation equipment respondents named the problem directly: "High steel and aluminum prices (due to Section 232 tariffs) continue to make profitability a challenge." Another said their main customer is "shifting production from U.S. plants to Mexico plants."
Supplier decision framework: hold inventory or cut shifts?
For auto and aerospace tier suppliers, one weak month does not justify a structural response, but falling orders and backlogs do justify tightening the plan. A practical sequence:
-
Reconcile OEM releases against firm orders. Forecast releases can run ahead of what the customer actually commits to. Build to the firm portion and treat the rest as a planning range, not a production target. If your customer is moving volume to other plants, as one ISM respondent reported, the releases are where you will see it first.
-
Weigh carrying cost against metal price exposure. With the ISM prices index at 71.1 and respondents citing Section 232 steel and aluminum costs, buying ahead can look like a hedge. It only works if the finished goods ship. Compare the carrying cost of raw material and finished inventory against the expected price move, and against the risk that a thinner order book leaves parts on the shelf.
-
Use flexible labor levers before permanent ones. ISM still shows expansion, employment is above 50, and August data is preliminary. Cutting overtime, dropping a weekend shift or reducing temporary headcount preserves the ability to ramp back up. Permanent layoffs of skilled operators are expensive to reverse in a tight trades labor market.
-
Put the slack to work. Idle hours are the cheapest time to schedule planned maintenance, changeover studies and line rebalancing. Before you pull a line down, use our downtime cost calculator to separate lost contribution margin from incremental recovery costs. When the line was not going to be fully loaded anyway, planned downtime costs far less than the same outage in a busy month.
Machinery builders face the opposite question. At 83.4% utilization, the risk is quoting lead times you cannot hold. The softer business equipment market group (down 0.5%) is worth watching as a signal of whether that tightness lasts, but the August data shows machinery output still rising.
A note on aerospace
Aerospace and miscellaneous transportation equipment fell 1.2% in August after a 0.7% gain in July, and defense and space equipment fell 1.2%. Utilization fell back to the industry's long-run average. The Fed release does not attribute the decline to any specific program, company or event, and one month of data is not a trend. Aerospace suppliers should treat it as a single-month move and check it against their own customer schedules rather than reading a cycle into it.
What to watch next
-
The October G.17 release, covering September output, along with any revisions to August. A revision could change the size of the decline or the streak itself.
-
ISM September new orders and backlog readings. Another drop in both would confirm that the August softness is feeding through to order books.
-
OEM production schedules, especially in autos, where utilization is already more than five points below its long-run average.
The takeaway for plant managers: August was the first factory output decline after seven monthly gains, and it hit autos and aerospace hardest, but the broader survey data still shows expansion. Trim with flexible levers, build to firm orders, use the slack for maintenance, and wait for the September data before making permanent cuts.
Related reading
-
25,000 Steelworkers Are on a 30-Day Clock. Boeing's 17,000 Engineers Come Back to the Table Sept. 8.
-
Lease or Buy the Next CNC Machine After the Fed's Rate Hike?
-
What Tier-3 Foundries Should Expect From the GE Castings Deal
-
GM Walked Away From a 680-Acre Battery Plant. Samsung SDI Is Finishing It for the Grid.