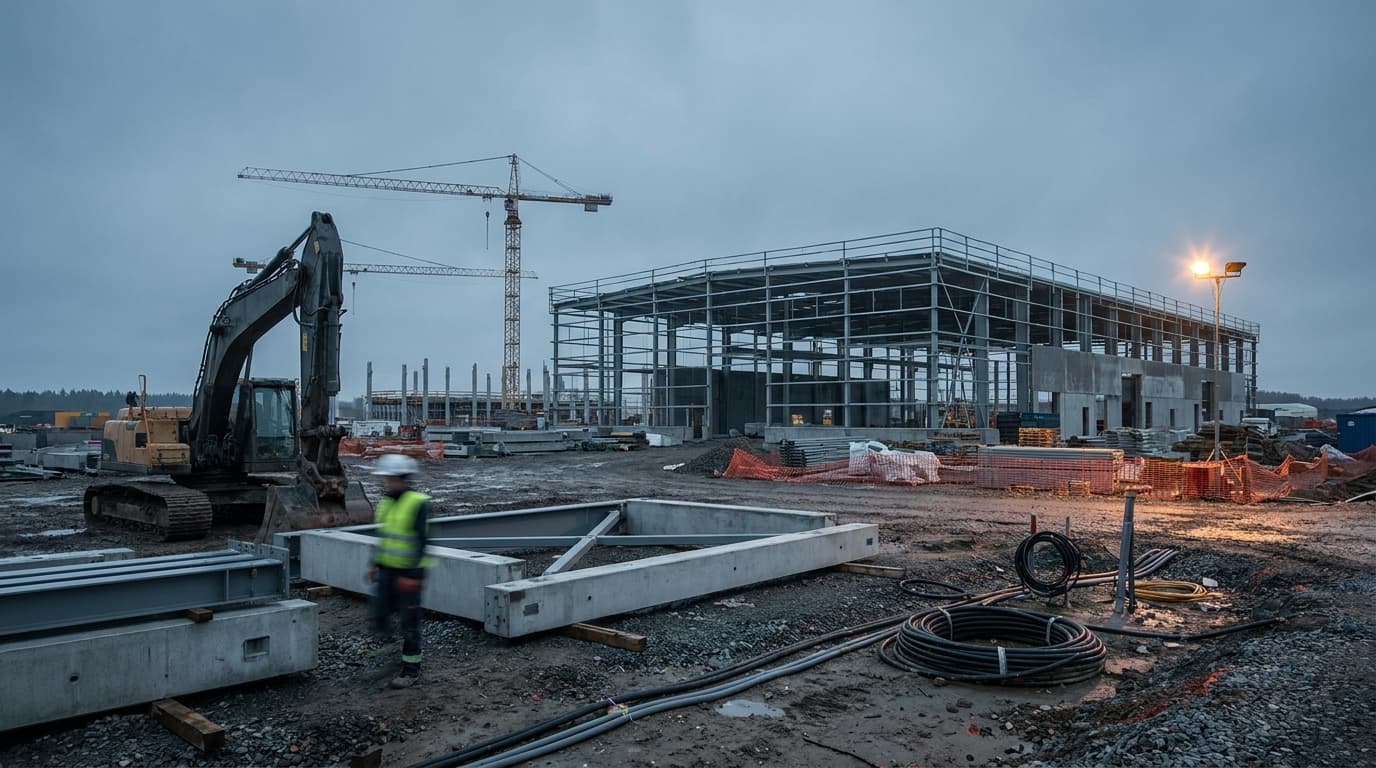
Two numbers are circulating in American industrial policy right now, and they point in opposite directions.
The first: $1.966 trillion in announced US manufacturing investment across 234 companies in 42 states plus Puerto Rico, per the IndustrialSage US Manufacturing Investment Tracker as of its August 24, 2026 update. It is a number that only goes up.
The second: $172.674 billion. That is the seasonally adjusted annual rate of total US manufacturing construction put in place in June 2026, from the [Census Bureau's C30 release of August 3, 2026](https://www.census.gov/construction/c30/pdf/release.pdf). Year to date — January through June, not seasonally adjusted — the figure is $87.008 billion against $111.749 billion in the same period of 2025. That is a decline of 22.1%.
These two numbers are not in conflict, because they are not the same unit. One is a multi-decade stock of corporate intent. The other is a monthly flow of contractor invoices. The purpose of this piece is to convert one into the other, show the arithmetic, and then report the thing nobody has written up: in 2026, the American construction buildout quietly changed subject. Fabs are not what is being built anymore. Data centers and power are.
The C30 arithmetic, in the open
Pull the August 3 release and check these against Table 1 (seasonally adjusted annual rate) and Table 2 (year to date, not seasonally adjusted):
-
June 2026 total manufacturing construction: $172.674 billion SAAR. May, revised, was $174.697 billion.
-
Year over year, single month: $172.674B against $219.564B in June 2025 — down 21.4%. Private-only: $170.309B against $218.322B, down 22.0%.
-
Year to date (Table 2, NSA): $87.008B versus $111.749B — down 22.1%. Private-only: $86.183B versus $111.141B, down 22.5%.
-
From the peak: total manufacturing construction topped out in September 2024 at $250.233 billion SAAR. June 2026 is 31.0% below that. Private-only peaked the same month at roughly $249.1B and is down 31.6%.
That September 2024 peak is worth stating precisely, because it gets misreported. August 2024 ($249.757B) and November 2024 ($250.089B) both sit just below September. You can verify the whole series in one click on FRED's TLMFGCONS.
Now the conversion. $1.966 trillion in announced investment, divided by the current $172.674 billion annual pace of all US manufacturing construction — every sector, every state, every project — is about 11.4 years of total national output to absorb a single tracker's announcement stock. And the actual 2026 pace is worse than the run-rate suggests it should be: H1 spending of $87.008 billion annualizes to roughly $174 billion, and it is falling.
What the tracker actually verifies
IndustrialSage's methodology is transparent and, on its own terms, sound: it counts announced reshoring, foreign direct investment, and expansion projects of $50 million or more, verified against SEC filings, press releases, and government announcements. What it does not publish is any subtraction methodology for cancellations or delays. The number ratchets up weekly.
The concentration matters more than the total. The top eight companies account for 76.2% of the $1.966 trillion: Apple $600B, TSMC $265B, Micron $260B, IBM $150B, Texas Instruments $60B, Johnson & Johnson $58B, AstraZeneca $54.5B, Roche $50B.
Apple alone is 31% of the tracker — and Apple's $600 billion is a multi-year, US-wide spending pledge that covers supplier payments, silicon purchases, and existing operations. Almost none of it is construction put in place. IBM's $150 billion has the same shape. There is nothing dishonest about either commitment; they are simply denominated in a different currency than concrete, steel, and contractor draws. C30 counts the latter. The tracker counts the former. They were never comparable, and treating a decline in one as a failure rate in the other is a category error.
So state the guardrail plainly: −22.1% is a decline in spending flow, not a 22% announcement failure rate. Anyone using this number the second way is misusing it.
The honest counterargument
Before going further, concede what a defender of the boom would say, because it is partly right.
A large share of the 2022–23 megaproject wave has moved out of heavy civil — sitework, foundations, structural steel, the phases that consume enormous dollars fast — and into fit-out, cleanroom qualification, and commissioning. Spending mechanically declines as a plant approaches completion, even when the plant is entirely on schedule and will produce exactly what was promised. A falling C30 line is, in part, the sound of projects finishing.
That is real. It explains some of the 22%. It does not explain the semiconductor number.
The fab collapse
The C30 release PDF does not carry subsector detail. The private seasonally adjusted time series workbook does, and it contains the most dramatic verified number in this story.
Private construction in the "computer, electronic and electrical" category — the fab line — peaked in June 2024 at $126.353 billion SAAR. In June 2026 it is $52.869 billion. That is down 58.2% from peak and 46.9% year over year.
A 58% two-year collapse with new starts failing to replace completions is not a commissioning artifact. It is a pipeline that stopped refilling. And the project ledger says why.
The Congressional Research Service's report R49031, published July 14, 2026, is the cleanest project-by-project account available. Intel's Ohio One campus — $28 billion, backed by a $1.5 billion CHIPS award — has moved from 2026 to 2030–2031, and Intel has said the project could be cancelled outright if it cannot secure customers, though construction was still proceeding as of June 2026. Micron's New York project slipped from 2028 to Q3 2030. Amkor's Arizona facility moved from 2027 to 2028. TSMC's Arizona Fab 2 slipped to 2028 before being pulled back to 2027. Samsung's Texas timeline moved from 2024 to 2025. On awards: as of January 2025, Commerce had committed $30.7 billion to 19 companies across 40 commercial fab projects, and as of June 2026, 12 companies with preliminary agreements were still waiting on final awards.
Outside semiconductors, the cancellations are named and quantified. Per Manufacturing Dive: Kore Power's $1.2 billion Arizona battery cell plant was cancelled and the site listed for sale, having never received its $850 million conditional DOE loan. T1 Energy — formerly Freyr — cancelled a $2.5 billion Georgia battery plant and 700-plus jobs. AESC paused a $1.6 billion South Carolina EV battery plant after construction had begun in 2023. Bosch halted a $200 million South Carolina hydrogen fuel cell facility. In total, more than $32 billion of clean energy manufacturing projects were cancelled during 2025 amid incentive rollbacks and tariff policy.
The finding: two crossovers happened in 2026
Here is what the workbook shows that the release does not, and that has not been reported.

Crossover one: data centers passed fabs in April 2026.
| Month (private, SAAR) | Computer/electronic/electrical (fabs) | Data center |
|---|---|---|
| June 2024 (fab peak) | $126.353B | — |
| March 2026 | $61.4B | $58.1B |
| April 2026 | $57.9B | $61.9B |
| June 2026 | $52.869B | $68.297B |
April 2026 is the month the lines cross. By June, data center construction hit $68.297 billion — an all-time record, up 45.8% from $46.850 billion in June 2025 — while fabs fell to $52.869 billion. One line is compounding; the other has halved twice over.
For scale: data center construction is now roughly 1.5x general office construction ($44.2 billion) and rising while general office falls. Census reports total office at $132.750 billion, up 12.5% year over year. The "office" line in C30 is now substantially an AI-infrastructure line, and reading it as commercial real estate will mislead you.
Crossover two: power passed manufacturing in June 2026.
Total power construction reached $177.635 billion SAAR in June 2026, up 3.5% year over year, exceeding total manufacturing construction at $172.674 billion. Private power, at $157.907 billion, is also a record. You can confirm the series on FRED's TLPWRCONS and compare it directly against TLMFGCONS.
Taken together: the reshoring buildout has not merely slowed. It has been structurally displaced by the AI buildout, competing for the same trades, the same switchgear, and the same interconnect queue — and C30 records the handoff month by month.
Follow the constraint, not the announcement
Announcements are cheap. Backlog and long-lead equipment are not, which makes them the better instrument.
Associated Builders and Contractors' Construction Backlog Indicator fell to 8.0 months in July 2026, down 0.8 months both month over month and year over year. The headline is soft; the split is the story. The 12% of ABC members holding data center contracts report 11.4 months of backlog. The other 88% report 7.5. Contractors in the $30–50 million revenue band — the mid-market general and specialty firms that carried the CHIPS-era buildout — are at their lowest backlog since March 2020.
ABC chief economist Anirban Basu put it directly: "The data center boom masks the depth of this weakness."
Then there is the hardware. Terrapin Construction Group's 2026 procurement data — which should be read as the firm's own manufacturer slot reservations and project experience, not an independent industry survey — puts current lead times at:
-
Medium-voltage 15kV switchgear: 52–80 weeks
-
38kV switchgear: 78–104 weeks
-
Pad-mount distribution transformers: 40–65 weeks
-
Substation transformers, 5–50 MVA: 75–110 weeks
-
Generator step-up transformers, >50 MVA: 100–150+ weeks
-
Large diesel generators, >3,000 kW: 90–110 weeks
A GSU transformer ordered today lands, at the long end, in 2029. Whoever holds those production slots controls the schedule for everyone downstream — and at current order volumes, that is hyperscalers, not chipmakers. This is the mechanism behind the crossover, not merely a correlate of it.
The 2027 EPC question
This is the least settled section in this piece, and it should be labeled as such.
As CHIPS-era heavy civil sunsets, does data center and power work absorb the Bechtel-tier backlog, or is there an air pocket in 2027? The optimistic case is straightforward: electricians, MEP trades, commissioning agents, and switchgear slots are broadly fungible across a fab, a data hall, and a substation. Those pools transfer.
The pessimistic case is that scopes do not. Cleanroom construction — ISO-class envelopes, tool hookup, ultrapure water and process gas distribution — is a specialized trade base that data center shell-and-core work does not employ. A contractor whose backlog was 60% cleanroom does not re-bid it as data hall work by changing the letterhead. The trades transfer; the firms and their qualifications may not. Watch the ABC $30–50 million cohort through Q4 2026 and Q1 2027 — that band is the early indicator, and it is already at post-COVID lows.
What operators should actually model
If you are bidding electricians, procuring transformers, or selecting a GC — particularly in Phoenix or Central Ohio, the two metros where fab, battery, and data center demand overlap on the same electrician and MEP pool — model the C30 subsector line and your equipment lead-time book. Not the tracker.
Intel's New Albany campus anchors Central Ohio. TSMC's north Phoenix fabs anchor the Valley. Both markets report thin pools of electricians, specialized MEP trades, and commissioning staff, with data center work actively pulling trades off commercial and tenant-improvement jobs. If you are competing for a journeyman wireman in New Albany in late 2026, your competitor is a hyperscaler, not a chipmaker — and that flipped in April.
Practically, that means three things. Price labor escalation against data center wage benchmarks, not fab ones. Treat switchgear and transformer slots as the binding path in any schedule that touches medium voltage, and reserve them before design is final. And when a counterparty cites an announcement total as evidence of demand, ask which C30 line it lands in and in which reference month.
Check it yourself
This entire analysis is reproducible in one afternoon with two public files.
The C30 release PDF carries Table 1 (SAAR) and Table 2 (year to date, not seasonally adjusted). Table 2 is where the 22.1% comes from: manufacturing YTD $87,008 million against $111,749 million. The private seasonally adjusted time series workbook carries the subsector columns — look for "Computer/electronic/electrical" and "Data center," with monthly history back to 1993. That workbook is where both crossovers live, and finding them takes about four minutes with a sort.
Release dates and methodology notes are on the C30 landing page. Re-run the arithmetic on the next release rather than taking this month's read as permanent — revisions to C30 are routine and sometimes material.
And restate the caveat one last time, because it is the one most likely to be dropped in the retelling: the 22.1% is a decline in construction spending, not a failure rate for announcements. The reshoring boom is not fraudulent. It is denominated in press releases while the concrete is denominated in months, and in 2026 the concrete went somewhere else.
Related reading
Sources
-
U.S. Census Bureau — Monthly Construction Spending, June 2026 (released August 3, 2026)
-
U.S. Census Bureau — C30 Private Construction Seasonally Adjusted Time Series (xlsx)
-
U.S. Census Bureau — Construction Spending (C30) landing page
-
FRED — Total Construction Spending: Manufacturing (TLMFGCONS)
-
IndustrialSage — US Manufacturing Investment Tracker 2026 (reading as of August 24, 2026)
-
[Congressional Research Service R49031 — Semiconductor Fabrication Facilities Funded by the CHIPS Act (July 14, 2026)](https://www.everycrsreport.com/reports/R49031.html)
-
Manufacturing Dive — 10 notable factory cancellations or openings in 2025
-
ABC's Construction Backlog Indicator decreases in July (July 2026 reading)